You’ve got to see this.
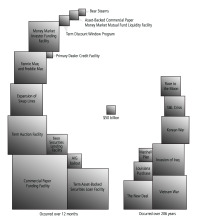
Barry Ritholtz of The Big Picture asked Jess Bachman of the excellent information-graphics site Wallstats to create a visual representation of the size of the $15 trillion worth of bailouts Ritholtz calculates we’ve doled out over the past year.
As Ritholtz says:
It is exceedingly difficult to convey exactly how much we are spending on all these bailouts. Whenever I start talking trillions (versus mere billions), I get puzzled looks from people. Humans have a hard time conceptualizing any number that large. I wanted a graphic way to clearly show how astonishingly ginormous the amounts involved were.
Eye-opening, to say the least.
Be careful to note that just because the gubmint (sorry, I’m home in Oklahoma right now) has put out this bailout money doesn’t mean it’s spent and gone, like that from, say, the Vietnam War. Most of this money is actually loans and presumably the government will get the vast majority of it back.
But even if it were to get an implausible 99 percent of it back, that would still be a $150 billion loss, or more than the Marshall Plan to rebuild Europe after World War II (these are inflation-adjusted dollars). If we get 97 percent back, that would be $450 billion, or enough to pay for both the Louisiana Purchase and the moonshot or for most of the New Deal. If we get 73 percent back, say, we could pay for all those things plus the Iraq war, the Korean War and the S&L crisis.
What can you say? Incredible.
I’d like to see someone analyze just how much of this $15 trillion or so we’ll end up eating. It’s impossible to predict, of course, but lay out some scenarios for whether we get 99 percent back or we get 50 percent back.
Ryan Chittum is a former Wall Street Journal reporter, and deputy editor of The Audit, CJR’s business section. If you see notable business journalism, give him a heads-up at rc2538@columbia.edu. Follow him on Twitter at @ryanchittum.