McClatchy investigates doings in the cotton market, which like other commodities has been roiled by volatility in recent years largely because financial-industry speculators have poured in placing bets. I don’t doubt this has happened, but unfortunately, McClatchy doesn’t prove it.
The first problem is we’re not given any context on historical cotton futures prices beyond the last two years or so. They soared 140 percent in the eighteen months to March 7, and have plunged 55 percent since, McClatchy reports. How atypical are these moves? We’re not told.
This is where a chart would have been helpful. Here’s one I put together at Trading Economics that shows cotton future prices for the last four decades:
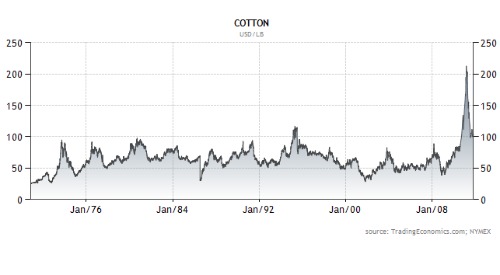
You can see clearly that from this that cotton futures are relatively volatile, but nothing like what happened in the last two years, when they skyrocketed more than 300 percent from March 2009 to March 2011 (McClatchy’s 140 percent number only captures the run up from September 2009 or so).
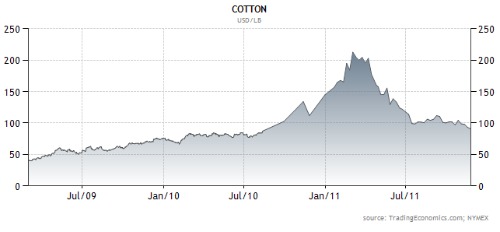
But if you zoom into the numbers, you can see that we’ve had similar spikes before, if not quite 300 percent. Here’s what the most recent bubble looked like, from March 2009 to today:
Here are cotton futures from October 1972 to October 1974:
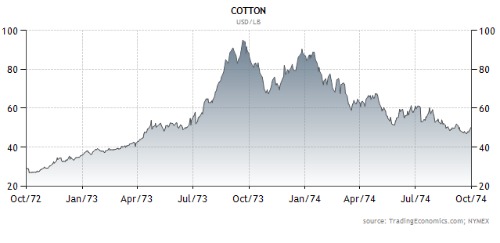
Cotton went up more than 200 percent in less than a year before falling by half within the next twelve months. Can’t blame that one on automated trading, hedge funds, and index funds.
Moreover, that first chart I showed you was somewhat deceiving in terms of showing historical volatility. The blowout of 2009 to 2011 makes the y-axis taller, which makes it harder to see volatility in lower numbers. Here’s what that chart looks like when you cut it off before the huge spike of the last couple years:
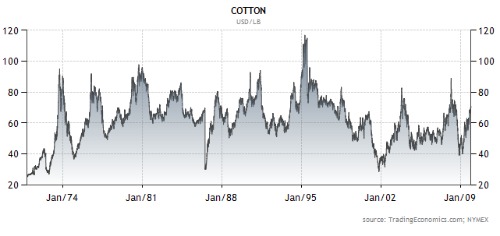
From this we can see a 55-plus percent cliff dive in 1986, followed by a 150 percent jump in about a year. There are other big spikes too. Point is, there has always been volatility in the cotton markets. That doesn’t mean the recent bubble wasn’t driven by newfangled speculators, but it also makes the correlation less convincing.
Here’s the basis of McClatchy’s finding that more speculators have coincided with more volatility:
That changed after the first week of September 2009, when the CFTC began providing data that separated out futures contracts held by swap dealers — financial players betting on cotton but not producing, processing, merchandising or using it. The agency also began reporting contracts held by money managers — big pension funds and the like that trade cotton contracts on behalf of pensioners or investors.
For much of the prior 20 years, the data showed commercial players, presumably growers and buyers, accounted for roughly 70 percent to 75 percent of cotton trading. That’s in line with historical trends for crude oil and other commodities, where speculators had until recent years accounted for only about a quarter of all futures contracts held.
But on the very first week of the broader reporting, the data shows that financial speculators actually had 61 percent of all cotton contracts. Since then, the percentage has come down to the 50 percent range, but it’s still high by historical standards.
I don’t think we can make anything out of this data. McClatchy says that the CFTC data before September 2009 showed that just 25 to 30 percent of trading was done by speculators. Then the CFTC changed how it reported the data and in the first week it jumped to 61 percent. This is apples and oranges. It doesn’t show us anything about how much speculation has increased since we’re dealing with different data sets.
And this doesn’t make sense:
Sifting through CFTC historical data, McClatchy found that the total number of outstanding futures contracts grew by about 80 percent from 1990 to 2010. That’s big growth in a historically small market.
Moreover, the number of contracts doubled between 2004 and 2010.
So contracts were up 100 percent from 2004 to 2010 but only 80 percent from 1990 to 2010? That implies futures contracts declined from 1990 to 2004, which seems unlikely. I suspect from the “moreover” that McClatchy meant that contracts grew 80 percent to 2004 and another 100 percent from there to 2010. This is where a link to the data it’s using would come in helpful, but the chain doesn’t have any links in its piece.
And aside from volatility, it’s worth noting that cotton prices, which averaged about 75 cents in 1990, are up far less than the price of inflation since then. If they’d kept pace with inflation, they’d be about 30 percent higher than they are now.
Again, it’s reasonable to suspect that Wall Street drove the most recent cotton bubble and I don’t doubt there has been a surge in speculators in cotton, as there has been in other commodities. But this piece doesn’t prove it.
Ryan Chittum is a former Wall Street Journal reporter, and deputy editor of The Audit, CJR’s business section. If you see notable business journalism, give him a heads-up at rc2538@columbia.edu. Follow him on Twitter at @ryanchittum.