We live in a data society. Journalists are becoming data analysts and data curators, and computation is an essential tool for reporting. Data and computation reshape the way a reporter sees the world and composes a story. They also control the operation of the information ecosystem she sends her journalism into, influencing where it finds audiences and generates discussion.
So every reporting beat is now a data beat, and computation is an essential tool for investigation. But digitization is affected by inequities, leaving gaps that often reflect the very disparities reporters seek to illustrate. Computation is creating new systems of power and inequality in the world. We rely on journalists, the “explainers of last resort”[1], to hold these new constellations of power to account.
We report on computation, not just with computation.
While a term with considerable history and mystery, artificial intelligence (AI) represents the most recent bundling of data and computation to optimize business decisions, automate tasks, and, from the point of view of a reporter, learn about the world. (For our purposes, AI and “machine learning” will be used interchangeably when referring to computational approaches to these activities.) The relationship between a journalist and AI is not unlike the process of developing sources or cultivating fixers. As with human sources, artificial intelligences may be knowledgeable, but they are not free of subjectivetivity in their design — they also need to be contextualized and qualified.
Ethical questions of introducing AI in journalism abound. But since AI has once again captured the public imagination, it is hard to have a clear-eyed discussion about the issues involved with journalism’s call to both report on and with these new computational tools. And so our article will alternate a discussion of issues facing the profession today with a “slant narrative” — indicated because these sections are in italics.
The slant narrative starts with the 1964 World’s Fair and a partnership between IBM and The New York Times, winds through commentary by Joseph Weizenbaum, a famed figure in AI research in the 1960s, and ends in 1983 with the shuttering of one of the most ambitious information delivery systems of the time. The simplicity of the role of computation in the slant narrative will help us better understand our contemporary situation with AI. But we begin our article with context for the use of data and computation in journalism — a short, and certainly incomplete, history before we settle into the rhythm of alternating narratives.
Data, Computation, and Journalism
Reporters depend on data, and through computation they make sense of that data. This reliance is not new. Joseph Pulitzer listed a series of topics that should be taught to aspiring journalists in his 1904 article “The College of Journalism.” He included statistics in addition to history, law, and economics. “You want statistics to tell you the truth,” he wrote. “You can find truth there if you know how to get at it, and romance, human interest, humor and fascinating revelations as well. The journalist must know how to find all these things—truth, of course, first.”[2] By 1912, faculty who taught literature, law, and statistics at Columbia University were training students in the liberal arts and social sciences at the Journalism School, envisioning a polymath reporter who would be better equipped than a newsroom apprentice to investigate courts, corporations, and the then-developing bureaucratic institutions of the 20th century.[3]
With these innovations, by 1920, journalist and public intellectual Walter Lippmann dreamt of a world where news was less politicized punditry and more expert opinion based on structured data. In his book Liberty and the News, he envisioned “political observatories” in which policy experts and statisticians would conduct quantitative and qualitative social scientific research, and inform lawmakers as well as news editors.[4] The desire to find and present facts, and only facts, has been in journalism’s DNA since its era of professionalization in the early 20th century, a time when the press faced competition with the new—and similarly to photography and cinema, far more visceral—media: the radio.[5] It was also a time when a sudden wave of consolidations and monopolization rocked the press, prompting print journalists to position themselves as a more accurate, professional, and hopefully indispensable labor force. Pulitzer and William Randolph Hearst endowed journalism schools, news editor associations were formed and codes of ethics published, regular reporting beats emerged, professional practices such as the interview were formed, and “objectivity” became the term du jour in editorials and the journalistic trade press.[6]
“Cold and impersonal” statistics could “tyrannize over reason,”[7] Lippmann knew, but he had also seen data interpreted simplistically and stripped of context. He advocated for journalists to think of themselves as social scientists, but he cautioned against wrapping unsubstantiated claims into objective-looking statistics and data visualizations. However, it took decades until journalism eased into data collection and analysis. Most famously, the journalist and University of North Carolina professor Phillip Meyer promoted the new style in journalistic objectivity, known from the title of his practical handbook as “precision journalism.”[8]
Precision journalism gained popularity as journalists took advantage of the Freedom of Information Act (FOIA), passed in 1967, and used it and other resources to make up for some chronic deficiencies of shoe-leather reporting. Meyer recounts reporting with Louise Blanchard[9] in the late 1950s on fire and hurricane insurance contracts awarded by Miami’s public schools. Nobody involved in the awards would talk about the perceived irregularities in the way no-bid contracts were granted, so Meyer and Blanchard analyzed campaign contributions to school board members and compared them to insurance companies receiving contracts. The process required tabulation and sorting—two key components at which mainframe computers would excel a decade later.[10] Observing patterns—as opposed to single events or soundbites from interviews—introduced one of the core principles of computer assisted reporting (CAR): analyzing the quantitative relationship between occurrences, as opposed to only considering those occurrences individually.
As computation improved, most reporters began to use spreadsheets and relational databases to collect and analyze data. This new agency augments investigative work: individual journalists can interpret, collect, and receive data to characterize situations that might otherwise be invisible. Meyer’s early stories helped make computation feel like the logical, and increasingly necessary, work of a reporter. But this is only a beginning for the advances in reporting and news production that computation represents for the profession. There is more ahead for computational journalism—that is, journalism using machine learning and AI—and we will explore the complexities in the remainder of this article.
This historical presentation has been brief and incomplete, but it is meant to provide a context for the use of data and computation in journalism. We are now going to retreat to a point in the middle of this history, the early 1960s, and begin our narrative with the 1964 World’s Fair.
1964—An elaboration of human-scale acts
For the IBM Pavilion at the 1964 World’s Fair in New York, Charles Eames and Eero Saarinen designed an environment that was meant to demystify the workings of a computer, cutting through the complexity and making its operations seem comprehensible, even natural. The central idea was that computer technologies—data, code, and algorithms—are ultimately human.
“… [W]e set forth to create an environment in which we could show that the methods used by computers in the solution of even the most complicated problems are merely elaborations of simple, human-scale techniques, which we all use daily.
“… [T]he central idea of the computer as an elaboration of human-scale acts will be communicated with exciting directness and vividness.”
Designer’s Statement by Charles Eames and Eero Saarinen, 1964
At the heart of their pavilion was The Information Machine, a 90-foot high ovoid theater composed of 22 staggered screens that filled a visitor’s field of view. The audience took their seats along a steep set of tiers that were hoisted into the dome theater. The movie, or movies, that played emphasized that the usefulness of computation goes beyond any specific solution. The film is really about human learning as a goal—about how we gain insight from the process leading to and following a computation. The next quote comes from an IBM brochure describing The Information Machine—it is the film’s final narration followed by the stage direction for its close.
Narrator: “…[T]he specific answers that we get are not the only rewards or even the greatest. It is in preparing the problem for solution, in these necessary steps of simplification, that we often gain the richest rewards. It is in this process that we are apt to get an insight into the true nature of the problem. Such insight is of great and lasting value to us as individuals and to us as society.”
With a burst of music, the pictures on the screens fade away, your host comes back to say goodbye. Below you, the great doors swing open… The show is over.
IBM Description of “The Information Machine”, 1964
In subsequent reviews of the pavilion, the design of The Information Machine was said by some critics to walk a fine line, attempting to make the computer seem natural on the one hand, but conveying its message through pure spectacle on the other—with the dome theater, the coordinated screens, and the large, hydraulic seating structure. The end effect is not demystification but “surprise, awe and marvel.”[11] In contemporary presentations of computation, and in particular AI and machine learning, we often lose the human aspects and instead see these methods just with “surprise, awe and marvel” — a turn that can rob us of our agency to ask questions about how these systems really operate and their impacts.
Contemporary Reporting and Its Relation to AI
Creating data, filling the gaps
The commentary in Eames’ film reminds us that computational systems are human to the core. This is a fact that we often forget, whether or not it is expressed in an advertising campaign for IBM. Reporting depends on a kind of curiosity about the world, a questioning spirit that asks why things work the way they do. In this section, we describe how journalists employ AI and machine learning to elaborate their own human-scale reporting. How does AI extend the reach of a reporter? What blind spots or inequalities might the partnership between people and computers introduce? And how do we assess the veracity of estimations and predictions from AI, and judge them suitable for journalistic use?
The job of the data or computational journalist still involves, to a large extent, creation of data about situations that would otherwise be undocumented. Journalists spend countless hours assembling datasets: scraping texts and tables from websites, digitizing paper documents obtained through FOIA requests, or merging existing tables of data that have common classifiers. While we focus on the modeling and exploration of data in this section, some of the best reporting starts by filling gaps with data sets. From the number of people killed in the US by police[12] to the fates of people returned to their countries of origin after being denied asylum in the US,[13] data and computation provide journalists with tools that reveal facts about which official records are weak or nonexistent.
In another kind of gap, computational sophistication is uneven across publications. Some outlets struggle to produce a simple spreadsheet analysis, while large organizations might have computing and development resources located inside the newsroom or available through an internal R&D lab. Organizations such as Quartz’s AI Studio[14] share their resources with other news organizations, providing machine learning assistance to reporters. Journalism educators have slowly begun to include new data and computing tools in their regular curricula and in professional development. Many of the computational journalism projects we discuss in this article are also collaborations among multiple newsrooms, while others are collaborations with university researchers.
The Two Cultures
Querying data sources has become an everyday practice in most newsrooms. One recent survey found that almost half of polled reporters used data every week in their work.[15] Reporters are experimenting with increasingly advanced machine learning or AI techniques, and, in analyzing these data, also encounter different interpretations of machine learning and AI. As statistician Leo Breiman wrote in 2001, two “cultures” have grown up around the questions of how data inform models and how models inform narrative.[16]
Breiman highlights the differences between these two groups using a classical “learning” or modeling problem, in which we have data consisting of “input variables” that, through some unknown mechanism, are associated with a set of “response variables.”
As an example, political scientists might want to judge Democratic voters’ preferences for candidates in the primary (a response) based on a voters’ demographics, their views on current political topics like immigration, characteristics of the county where they live (inputs). The New York Times recently turned to this framework when trying to assess whether the Nike Vaporfly running shoe gave runners an edge in races (again, a response) based on the weather conditions for the race, the gender and age of the runner, their training regime and previous performances in races (inputs).[17] Finally, later in the article we will look at so-called “predictive policing,” which attempts to predict where crime is likely to occur in a city (response) based on historical crime data, as well as aspects of the city itself, like the location of bars or subway entrances (inputs).
Given these examples, in one of Breiman’s modeling cultures, the classically statistical approach, models are introduced to reflect how nature associates inputs and responses. Statisticians rely on models for hints about important variables influencing phenomena, as well as the form that influence takes, from simply reading the coefficients of a regression table, to applying post-processing tools like LIME (Local Interpretable Model-Agnostic Explanations)[18] to describe the more complex machine learning or AI models’ dependence on the values of specific variables. In this culture, models are rich with narrative potential—reflecting something of how the system under study operates—and the relationship between inputs and outputs offer new opportunities for reporting and finding leads.
The second modeling approach deals more with predictive accuracy — the performance of the model is important, not the specifics of how each input affects the output. In this culture, a model does not have to bear any resemblance to nature as long as its predictions are reliable. This has given rise to various algorithmic approaches in which the inner workings of a model are not immediately evident or even important. Instead, the output of a model—a prediction—carries the story. Journalists using these models focus on outcomes, perhaps to help skim through a large data set for “interesting” cases. We can judge the ultimate “fairness” of a model, for example, by examining the predicted outcomes for various collections of inputs. Since Breiman’s original paper in 2001 the lines between these two cultures have begun eroding as journalists and others call for explainability of algorithmic systems.
Classical Learning Problems and Narratives
The distinction between supervised and unsupervised learning problems is also a useful one. So far, we have considered models for so-called supervised learning, linking inputs to responses. ProPublica’s “Surgeon Scorecard,” for example, involved mixed-effects logistic regressions to assess nationwide surgeon and hospital performance on eight elective procedures, controlling for variables like a patient’s age, sex and “HealthScore.” Their modeling involved four years of hospital billing data from Medicare, 2.3 million data points in all. Buzzfeed’s “Spies in the Skies” series trained a machine learning model to recognize the flight patterns of FBI and DHS surveillance aircraft and applied the model to the flight paths of 20,000 other planes over four months, using the data to identify potential spy planes. In both cases, the news organizations published their data and code.[19][20] Recalling Breiman’s two cultures, in supervised learning the narrative can be produced from the outputs of a model (“Which flight paths correspond to spy planes?” or “Which surgeons are better than others?”) or the structure of the model itself.
In unsupervised learning, on the other hand, we don’t have responses. Instead, we use models to find patterns in a dataset—cluster analysis is a common example. Unsupervised learning, with its emphasis on exploratory analysis, has been used to identify patterns to create a narrative. The Marshall Project’s “Crime in Context” performed a form of analysis called hierarchical clustering to group cities in the United States based on the time series of historical crime statistics. The reporters were asking a succinct question: What are the broader patterns of crime in cities over the last 40 years? Similarly, FiveThirtyEight’s “Dissecting Trump’s Most Rabid Online Following” applied an unsupervised procedure known as latent semantic analysis (LSA) to describe the character of the comment boards on Reddit, with two subreddits being similar if many users post to both. This results in what they call “subreddit algebra” — “adding one subreddit to another and seeing if the result resembles some third subreddit, or subtracting out a component of one subreddit’s character and seeing what’s left.” Again, both organizations, The Marshall Project and FiveThirtyEight, released data and/or code for their stories.[21]
In all of the cases mentioned, from the Surgeon Scorecard to FiveThirtyEight’s analysis of Reddit, AI has helped journalists scale up their reporting, asking questions of systems that would otherwise be beyond their reach. But difficult technical questions come with this stretch—questions about whether a model adequately describes the data it draws on, and about whether we are more inclined to trust a model because it agrees with beliefs we held before we performed an analysis. Have we merely given our prior opinions an air of scientific validity? The use of machine learning in forming narratives from data requires a degree of caution. Consulting technical experts is always sensible in complex situations—each of the stories we cited had a statistician, a computer scientist, or a data scientist contributing to or performing the analysis.
Dealing with Uncertainty and Criticism
As with any statistical procedure, conveying uncertainty became an important component of these stories. When journalists express uncertainty of a model in their stories, they show that the data and the fitted model are inherently “noisy,” that not all data can be fully explained by the model. They also tell their readers that they are aware of the limits and constraints of their analysis. ProPublica, for example, incorporated uncertainty assessments along with its “Surgeon Scorecard” visualizations — publishing individualized data of this kind can raise ethical concerns, and the data could easily give an incorrect impression without the proper assignment and representation of uncertainty. BuzzFeed explicitly noted the fallibility of its algorithm—the algorithm would mistake circular flight paths over skydiving centers for surveillance operations—and relied on traditional reporting to check for false positives. False negatives— in this case, surveillance planes with uncharacteristic behaviors—could escape the attention of the reporters, they noted.
Predictions of the winner of the 2016 presidential election, computed by many journalistic outlets, often lacked any prominent assessment of uncertainty. Large percentage indicators in red and blue type held many anxious voters’ attention captive for months. Then on election night, The New York Times faced sharp criticism for a controversial piece of code, the JITTER.get()command in its infamous “needle” data visualization—while the needle’s jitter, or random vibration, was designed to reflect the uncertainty in the selection of the current frontrunner, readers instead viewed it as expressing live, incoming data updates. In response, during the lead-up to the 2018 midterms, The Times explored a real-time polling approach that tried to unpack the mechanisms behind modern surveys. The new project promised “you’ll learn what the so-called margin of error means in a more visceral way than ‘+/- 4%’ can ever convey,” and that you would understand the difficulties in conducting an accurate poll.[22]
Communicating uncertainty effectively is already a complex problem, more so when it comes to investigations. As Jonathan Stray, research fellow at The Partnership on AI, points out,[23] some forms of reporting require journalists to be certain of wrongdoing before they publish a story about a crime. It is unlikely that a machine learning prediction will ever meet that standard, that degree of certainty. This forces journalism into new territory.
Journalists tend to be tool users rather than tool makers, and the application of advanced AI methods is not without growing pains. When a journalist’s reporting leads them into the realm of original research, they are open to the criticisms more commonly found in the academic review process, and not solely the questions posed by their editor. Explaining a computational methodology might fall into a “nerd box” published with a story, or there might also be a separate white paper and GitHub repo with source code if the complexity warrants it. ProPublica, for example, sought expert advice from academics, anticipating that different communities would examine their work. In the case of FiveThirtyEight’s Reddit story, the explanation of LSA served as the backbone of the story. In this way, machine learning is helping to create new narrative forms that allow deeper explanations of complex stories.
Implications for Practice
The journalistic examples discussed so far are neither unique nor even fully representative of the variety and rate of change taking place in the field. But they do highlight some of the problems that journalists have to contend with when partnering with AI. The first is simply the choice of available data that are used to represent some phenomenon being studied. This, together with the machine learning method selected define a kind of perceptual engine from which the journalist will ask questions, dig deeply into some situation, follow her curiosity. If there are blind spots, like missing bits of data, or classifiers that fail to capture important circumstances of a story, she has to engineer ways to identify them, checking on her methods.
Her work needs to be clear and well-documented—“Show your work!” is a longstanding appeal from the CAR community. To test the veracity of one reporter’s computation, some newsrooms even have a second reporter reproduce their results independently. In some cases, it is only the results of the model—or the implications of the results—that are verified independently, as in BuzzFeed’s surveillance article and the FiveThirtyEight Reddit piece. It did not matter how the conclusion was derived, only that it was correct. When journalists produce data-based observations on their own, their work is also open to other lines of critique. Standards from statistics, the social sciences, or even engineering may apply.
Standards for journalism have emerged from sessions at professional conferences, like the “Regression in the Newsroom” session at SRCCON 2018[24], an annual conference focusing on the intersection of journalism and technology, as well as a standards session on advanced modeling at 2019’s Online News Association meeting. Journalists have begun to recognize that the profession has to think through what tools it employs and how it should test the results of their use. Standardization is not purely the result of measured consideration among professionals: through reporting on AI, journalists are also defining a set of standards for their reporting with AI.
1964—“The Fair? We’re There!”
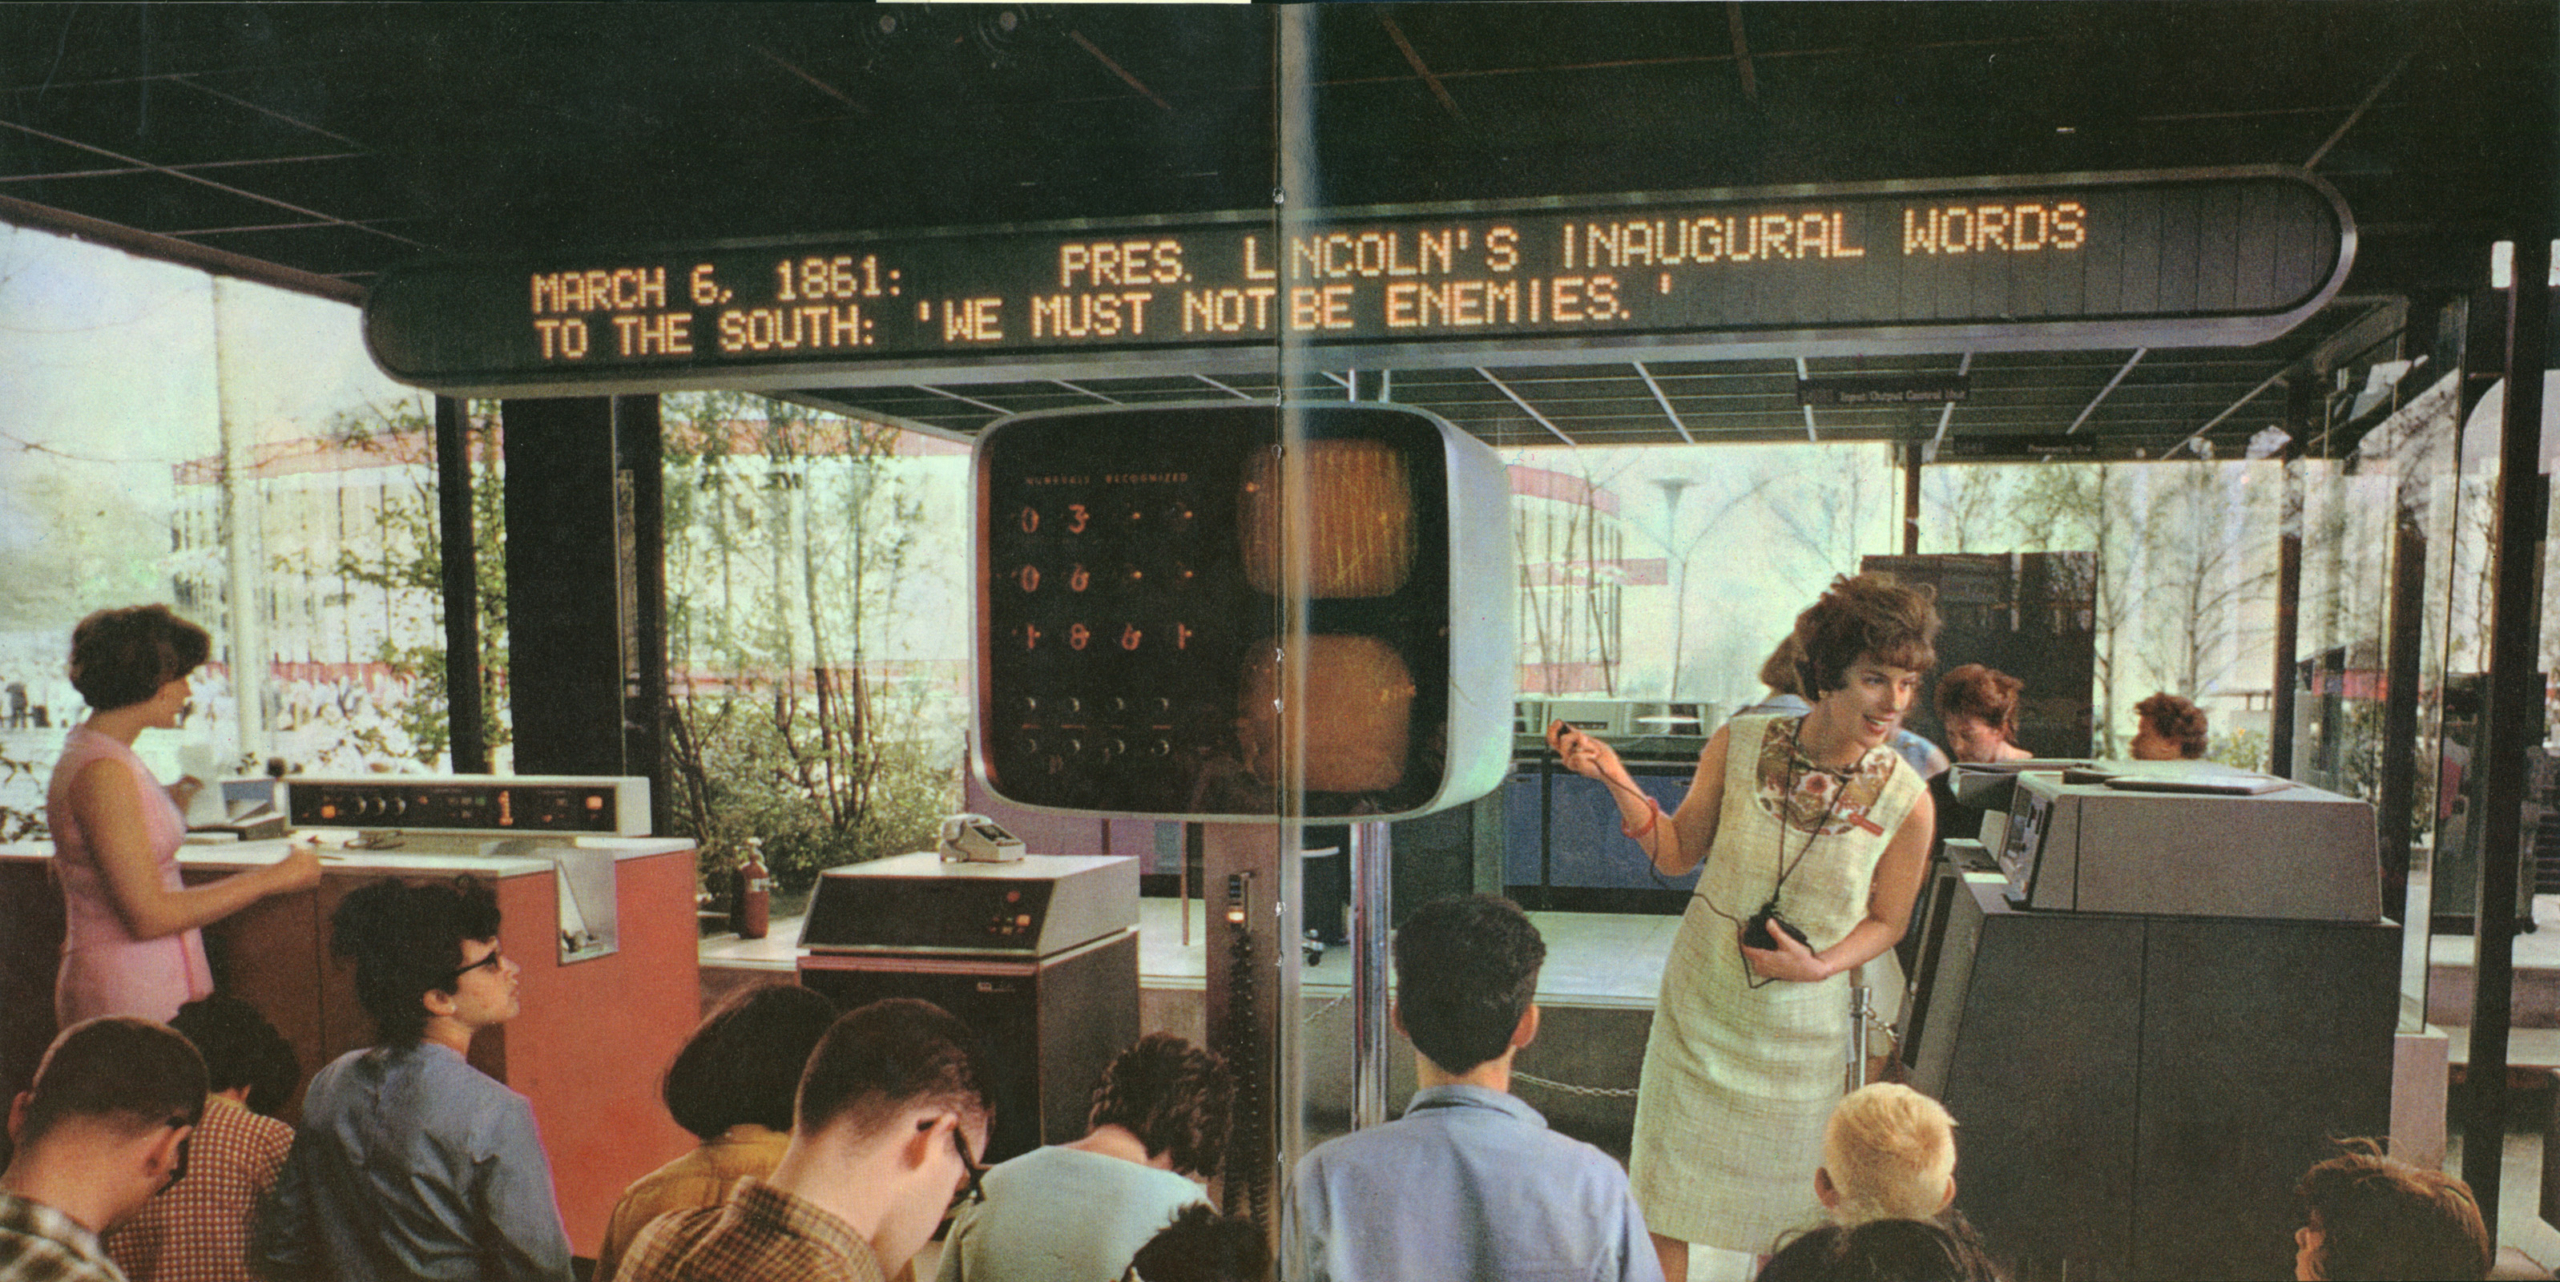
The New York Times was part of IBM’s presence at the 1964 World’s Fair. In a corner of the IBM pavilion was a machine trained to recognize handwritten dates. A visitor could write down a date—month, day, and year—on a card and feed it into an optical scanner. Before the fair, IBM researchers associated each date with an important news event reported in The Times. IBM researchers visited The Times’s headquarters on 43rd Street in Manhattan.
Way back last summer when the Fair was mostly a gleam in Robert Moses’s eye, I.B.M. researchers took over what used to be the Information Department on the 3rd floor, and began the exhaustive job of poring through microfilm editions of The Times, day by day since Sept. 18, 1851. They extracted from each day’s paper the most important news story and compressed it into headlines. This is the material that was fed into the I.B.M. machine.
The Times’ first issue appeared on September 18, 1851—although it was then known as the New York Daily Times—meaning the machine had full access to the paper’s archives. In their report of the IBM pavilion, Popular Science described the handwriting recognition machine in this way:[25]
“… [W]rite the date on a card and watch an electronic Ouija board gobble it up, read the handwriting, and seconds later spell out the banner headline of that day,”

Souvenir Card from IBM Pavilion at the 1964/1965 New York World’s Fair, from the Collections of The Henry Ford.
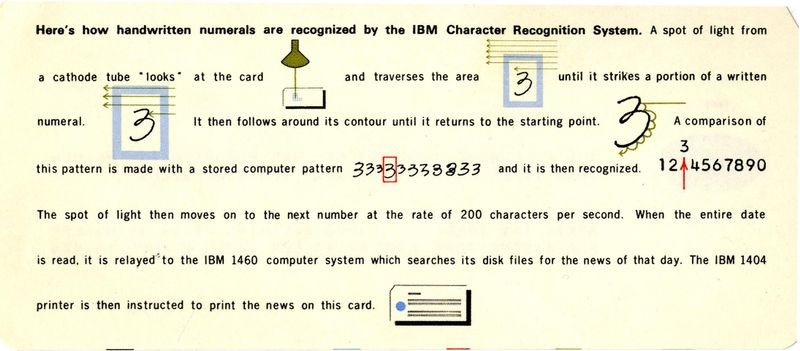
The card that was produced referenced a Times story on the front—with the headline written by an IBM researcher—and then a detailed explanation of the method used to recognize your date on the back. In describing the algorithm for a brochure accompanying the exhibition, the company described how an electronic beam outlines “the contours of each number by traveling around it in a series of continuous circles, in much the same way that children trace letters for penmanship exercises.”[26] The explanation was simple, keeping with the theme that computers enact “elaborations of human-scale acts.”
The front of the card, however, was the result of a myriad of human-scale acts, these primarily editorial. How did the IBM researchers select an important headline for a day? Was it the A1 story? Was it something that might have seemed less important on the requested date in 1900, but was seen as a pivotal moment by 1964? Did the headline have to involve familiar people and places for popular appeal? There is no explanation, at least none that we could find.
The handwriting recognition machine was also prepared for people who made unreasonable requests. When one visitor asked for a headline from April 22, 9999, for example, the machine returned a card reading “Since the date you have requested is still in the future, we will not have access to the events of this day for 2,934,723 days”[27] For IBM, the purpose of the exhibition seemed to be less about exhibiting Times’ content than demonstrating handwriting recognition and “the progress being made in finding better ways to enter data into computers”, and so that IBM could “reduce the time and cost now required to get this information from the people who create it to the high-speed computers that process it.”[28]

Printout of The Times’ headline database for the IBM Pavillion’s handwriting recognition system. Image by Mark Hansen.
The “database” of Times headlines assembled by IBM researchers, binding each day with an event, was printed out and bound as a series of books that eventually found their way into The Times’ clipping room or “morgue.” Ultimately, most of them were thrown out when The Times moved to their new building on 8th Avenue in Manhattan in 2007, but the current “keeper” of the morgue, Jeff Roth, saved three.
The News as Data
In IBM’s handwriting recognition machine, algorithms are an “elaboration of human-scale acts,” computational systems that could replace or augment human effort—in that case, tedious data input. We have already seen how AI and machine learning can help journalists report, but computation affects other kinds of human work supporting both the profession and the business. Algorithms recommend, personalize, moderate, and even assess fairness. In designing “editorial” systems, much can be learned about the original, human problem that AI or computation broadly is designed to address. In some cases, computation augments or replaces human labor. In others, algorithms perform “at scale” tasks that were not possible before, raising ethical questions. These editorial advances start with the view that the news itself can be thought of as data.
A1 v. AI: Maximizing (and Moderating) Engagement
Contemporary newsgathering relies heavily on computation. We start with a substrate of recorded observations of the world—digital recordings of firsthand accounts, traditional documents and spreadsheets, trends on social media, even real-time sensor data. These inputs can then be analyzed via AI to identify (and sometimes even author) stories, with roles for both supervised and unsupervised learning. When stories are published on the web and across social media, a digital cloud of audience reactions forms around them. And journalism is also data, open to a range of new kinds of treatments as such. In addition to the content of a story, modern news as an industrial, digital, and commercial product is bristling with metadata describing who produced it and what it is about.
Every story from The New York Times is “tagged” to categorize its content—a much more sophisticated system than IBM used in its index at the 1964 World’s Fair. The Times creates these tags using rules drawn partly from the frequency of words and phrases in the article, or their appearance in the headline or lede. The rules are passed on to a human in the newsroom who verifies or changes the tags. Eventually the “Taxonomy Team” adjusts rules and introduces new tags to The Times category vocabulary.[29] These tags might be used to help publishers make recommendations, or issue alerts when stories appear on a topic (one or more tags) that readers are interested in.
Because stories are data, a reader’s engagement with content is now data, as well. Computation and AI recommend content to readers, or add it to personal feeds. They may also adapt its form. Decisions about story placement are slowly shifting from morning news meetings to include personalization algorithms.
New strategies arise as organizations mix traditional of “A1” (front-page) page layout and the AI that sorts potentially A1-worthy stories according to its own logic. Small experiments are constantly running on many news sites—organized via classical A/B testing[30] and, recently, contextual “multi-arm bandits.” These tools collect user actions to make choices between stories placed on a site’s home page, writing different potential headlines for each story, or affecting the placement of different “page furniture” like illustrations, charts, or photographs. These AI systems attempt to maximize engagement. Other user-facing functions are being incorporated into “smart” paywalls that use AI to estimate the probability that a reader will respond in a specific way to an action taken by the publisher. Instead of capping your monthly allotment of free articles at 10, a smart paywall might extend your free period by 5 articles if it estimates your propensity to subscribe will increase significantly as a result.
These calculations might involve studying histories of readers’ actions on the site. Reader data retention—and the kinds of computations performed on that data—take on special importance for news organizations that report skeptically on other companies’ use or misuse of personal data, but personalize their own content to maximize engagement and sell advertising. Just recently, Chris Wiggins, the chief data scientist at The Times, announced that “We’re moving away from tracking analytics on people and towards tracking analytics on stories.”[31] As an example of flipping emphasis, The Times’ advertising team wondered if they could “accurately predict the emotions that are evoked by Times articles?” The answer was “Yes” and as a result determined “that readers’ emotional response to articles is useful for predicting advertising engagement.”[32]
As objects of computation, stories circulate across the web and on social media sites, each collecting their own data and employing their own AI systems guiding content sharing. Again, data about engagement (sharing and likes, say) can be optimized by a publisher, adapting messages that lead readers to their content. The AI run by social media platforms are typically opaque to news outlets, however, and many suffer when algorithms change, directing traffic and attention away from their sites.[33]
AI also shapes audience engagement with comment moderation. For many sites, comments from readers can quickly degenerate into harsh disagreements and away from anything resembling civil discourse. The Times once manually edited comments, but in 2017 gave much of this work over to Google, using a machine learning tool trained on 16 million Times-moderated comments dating back to 2007.[34] The tool estimated the probability that a comment would be rejected by a moderator, leaving the final judgment to a human working from a sorted list of comments.
Equity Questions
Collections of tagged news stories are at the core of many natural language processing toolkits,[35] providing a stable training bed with consistent language and stylistic standards. Text classification courses typically derive an automated tagger from a collection of news articles. But we can go much farther than just keywords now, using or developing tools that can treat text as data.
GenderMeme, for example, was a platform created by a pair of graduate students in Stanford’s Statistics Department.[36] It used various features from the text to identify the (binary) gender of the sources quoted in a story. The tool has found its way into two prominent news outlets, one of which has incorporated it into its content management system. And so in addition to a spell check option, and a list of suggested tags, reporters and editors can conduct a gender check—a simple report that “Of your 13 sources, 9 are male and 4 are female.” While the initial application is simply informational, the tool addresses real concerns in newsrooms about equity in sourcing.
Examining television news broadcasts, or even 24-hour news networks, is a heavier computational lift. Video is simply harder to analyze than flat text since computers recognize letters, numbers, and other characters, but require a lot of programming to identify objects represented by the pixels of a photo or a still image taken from a video. But computer vision has advanced to the point that it can reliably estimate who is doing the talking, as well as who and what is being talked about. Another Stanford Computer Science project, called Esper, has partnered with the Internet News Archive to tease apart gender and other equity issues on news outlets like CNN and Fox News.[37] Doing this at scale provides a view across months or years of data.
The work of assigning tasks to these systems, whether human or machine or cyborg, reduce to a set of institutional choices, which beat reporters will recognize from their own work: What questions do we ask and who gets to ask them? These are “elaborations of human-scale acts” and reflect the character of power in the newsroom.
Automated Stories
We can see news as data in two ways. In this section, we have examined the use of news as input used to categorize, creating structured data for recommendation engines, or to assess equity in sourcing. But news can also be the product of AI systems, auto-generated textual data describing the who, what, when, where, why, and how of an event in story form. Many large newsrooms have used this technology for some time in sports and financial reporting: Box scores in, news story out. Narrative Science, founded in 2010, was an early player, at first hand-crafting rule-based systems (called “heuristic programming”) and later building rules using machine learning. The AP outlined this technology and other AI applications in a popular recent whitepaper.[38] The AP’s “robo-journalism” about publicly-traded companies’ earnings reports “synthesizes information from firms’ press releases, analyst reports, and stock performance and are widely disseminated by major news outlets a few hours after the earnings release,” according to a recent study, which said the automated stories can affect “trading volume and liquidity.”[39] Much of the initial writing about AI-assisted story generation focused on workflows and human labor, but this study suggests impacts on our dynamic information ecosystem.
The widespread use of AI or machine learning to generate certain classes of stories, even if only in draft form, seems inevitable. The profession is working through the best way to augment reporters’ capabilities with those of a learning system—which stories are collaborations and which are fully automated? Various research projects are also looking at how these systems could be designed by journalists and not just for journalists, a transition that seems inevitable as the profession takes responsibility for more of its technology development — building methods and tools that reflect their unique values and ethics.
A Short Comment on Fakery
Importantly from our perspective in 2019, there have been several attempts to use AI to identify “fake news.” Approaches to misinformation range from automating fact-checking to identifying telltale patterns of coordination on social media designed to amplify a message—the “who” behind promoting a story is important data here. One recent approach involves defining a special set of tags for a news story known as “credibility indicators.”[40] “These indicators originate from both within an article’s text as well as from external sources or article metadata.”—from how “representative” the title is, to the tone of the article, to whether it was fact-checked. These indicators are designed to provide signals to third parties, including AI systems, designed to detect misinformation. As news stories have become data, we can scan them for signals that they are, well, news. The use of AI to tackle fakery is in its infancy. Some approaches focus on multimedia analysis to detect doctored images and video,[41] while another applies neural networks in an adversarial way, using AI to generate fake stories and building detectors from the features of the generated stories.[42]
1966—To Explain is to Explain Away
From 1964 to 1966, Joseph Wiezenbaum was developing his ELIZA program, an experiment in human-computer “conversation.” In short, a chatbot. Much has been written about ELIZA and its success, and the program has been republished in modern languages like Python.[43] At its core, ELIZA searches through a person’s input to the conversation for certain keywords. If a keyword is found, a rule is applied to transform their input and craft ELIZA’s response. Wiezenbaum’s program is an example of a kind of artificial intelligence that was often referred to as “heuristic programming”—it depends on “‘Hints’, ‘suggestions’, or ‘rules of thumb’” to quote the AI pioneer Marvin Minsky[44].
ELIZA worked a little too well, often convincing its users that they were interacting with a real person. This horrified Wiezenbaum, who eventually went on a campaign to explain its simple heuristics, “to further rob ELIZA of the aura of magic.”[45] His motivation was to expose the program as a set of computer instructions. He starts his 1966 paper on ELIZA this way:
It is said that to explain is to explain away. This maxim is nowhere so well fulfilled as in the area of computer programming, especially in what is called heuristic programming and artificial intelligence. For in those realms machines are made to behave in wondrous ways, often sufficient to dazzle even the most experienced observer. But once a particular program is unmasked, once its inner workings are explained in language sufficiently plain to induce understanding, its magic crumbles away; it stands revealed as a mere collection of procedures, each quite comprehensible. The observer says to himself ‘I could have written that’.
ELIZA is ultimately shown as the product of “human-scale acts,” but ELIZA’s own acts amount to impersonation. Here we see the balance between how the public receives AI and its underlying design—the magic versus the very real human dynamics expressed in data, code, and algorithms.
Explainers of Last Resort
The ubiquity of computation has led to questions about how these systems actually work. Ideas like “explainability” have been added to the concerns about speed and memory usage. In journalism, explainable systems help with reporting. When explainable, AI is open to direct interrogation, and, if the AI itself is open-source, can be examined line by line. This was Wiezenbaum’s attempt with ELIZA—demystify by “explaining away.” In his case, the rules ELIZA followed were one and the same with his algorithm, and “explaining” those rules was simply a matter of exhibiting code. With modern learning systems, the priority has been prediction accuracy, not explainability, and so we have produced small black boxes that we can only examine from patterns of inputs and outputs. Given the proprietary nature of many of our important software systems, journalists have a difficult time holding AI’s power to account.
While Wiezenbaum was reacting to impressions of ELIZA as “magic” in 1966, today’s journalists must contend with a perceptions of “objectivity” and “efficiency.” AI, informed by past data, is deployed to help news organizations “optimize” decisions. And, as a mathematical object, AI offers cover—the machine made the decision and we can pretend it is free of subjectivity. But there is rarely a single correct characterization of anything, including, what model should be employed to capture the relationship between “input” and “response” variables. What is being optimized when human journalists fit the model? Which human-scale acts should we elaborate? Our choices reflect our values, our biases, our blind spots.
Ultimately, we want to know, is it fair?
Algorithmic Accountability
AI tools themselves can be newsworthy. Sometimes they are applied to governance or management decisions; sometimes they contribute to social or political inequality in some way. Reporting on them is often called “algorithmic accountability,” and it is a thriving field. Nicholas Diakopoulos is an early figure in this area[46], and he maintains a website of potential reporting assignments on algorithms.[47]
A widely cited and early example is ProPublica’s article “Machine Bias” by Julia Angwin, Jeff Larson, Surya Mattu, and Lauren Kirchner, which described statistical models—algorithms—for computing “risk assessment scores” used by officials to set parole, grant probation, and even sentence the convicted. “If computers could accurately predict which defendants were likely to commit new crimes, the system could be fairer and more selective about who is incarcerated and for how long,”[48] officials reasoned. The reporters demonstrated that one such algorithm tended to score blacks as higher-risk than whites, and made more mistakes when scoring blacks. The debate between the company producing these scores and ProPublica focused, in part, on the different mathematical definitions of “fairness” used by each group, and highlighted the ethical problem of assigning a numerical value to human behavior and social situations. For example, ProPublica reported that although the company did not ask about race in its risk assessment questionnaire, it did ask whether a defendant’s friends used drugs or if their parents had been in jail. The measurement tool then used the responses to these questions as proxies to infer the risk of violence or recidivism.
While explainability makes accountability assessments easier, it also impacts the kinds of power a learning system enacts. Take, for example, The Marshall Project’s reporting on “predictive policing.”[49] Increasingly, municipalities outsource decisions about where to physically deploy officers during their shifts. An AI system attempts to predict where crime will occur and puts “cops on dots” for the next shift.
The programs typically overlay a grid system onto the city, dividing it into cells that measure a block or so on each side. One system, PredPol, makes predictions for each block using a proprietary algorithm inspired by mathematical models of earthquakes, the impact of a crime running through a neighborhood like an aftershock. It draws entirely on historical crime data to make its predictions and its code is entirely proprietary.[50] An alternative approach could model the probability of crime in a grid cell using both previous crimes and aspects of the city near the cell.
Developers of AI systems to predict crime could incorporate material and social aspects of these same environments, and re-embed their algorithmic system into that more complex environment. Those aspects are a natural extension of the data from which the algorithm learns: Is there a subway stop nearby? Are there bars nearby? Is there a full moon? The so-called risk terrain modeling[51] (RTM) is a method that specifically examines historical crime data, as well as the relationship between crime and the geographic features of the area where crime takes place. It takes a machine-learning approach to the problem and lets the AI system decide what conditions are dangerous. With an explainable model making the predictions, community stakeholders could be invited to work with law enforcement to diagnose what is making certain conditions dangerous, determining the underlying causes of crime. They can then have a say into the appropriate responses, since not all crimes are best prevented by deploying more officers in an area. In this way, reporting on systems of power that coalesce into AI systems can be more than an analysis of inputs and outputs, or even code audits — it can be a rich socio-technical exercise.
While it is expected that journalism, as a profession, would try to harness the power represented by data, code and algorithms, it is not necessarily a natural fit. Journalism education is becoming increasingly computational, venturing out from spreadsheet work into full-fledged coding courses that provide reporters with better understandings of technological systems. But what is the next step? Journalists call attention to systems of inequality, but should they also produce prototypes for the ethical application of AI? While we report on unfair algorithmic business practices, must we ensure that our own AI-powered paywalls behave fairly? If we seek explainability in algorithmic decision making, do we have the same degree of transparency in our own reporting?
The pedagogical effects have extended beyond journalism. Data science, interpreted broadly as an interdisciplinary field drawing inspiration from many research traditions and methodologies, could incorporate lessons from reporting on AI, and from the use of AI to support journalism. Through this interplay, journalism has attained a degree of data and computational rigor, while data science might find a public mission. At the very least, journalism can and is playing a role in helping AI practitioners adopt standards for responsible application of these tools.
1969—The Information Bank
The first automated retrieval system for news began at The New York Times in the early sixties.[52] Initially, the goal was to computerize access to The Times’ “Index,” a reference to the paper sent to libraries and universities, and used by students and researchers.
Later, the plan included creating a database from the files in The Times’ clipping library or “morgue.” Accessing information in the morgue was complex—it consisted of 20 million clippings (articles from The Times and other publications) with an indexing system described as “haphazard, inconsistent, inaccurate” and that only allowed each article to be filed under a single subject. The complexity was growing quickly, with about 10,000 clippings added to the library each week.[53]
Managers at The Times were receptive to the idea of computerization from a cost-cutting perspective—given the recent 1962-63 newspaper strike, they hoped an automated system could make their staff more efficient. Because of the expense of the project, The Times decided it could sell access to “outsiders” like libraries and universities, and create a new source of revenue. This was the first time the public could have a peek into The Times’ morgue.
Here is a portion of a 1969 press release announcing The Times’ Information Bank. It describes their aspirations—bold stuff.
We envision that the instantaneous accessibility of a gigantic store of background information on virtually every subject of human research and inquiry will prove to be of immeasurable value not only to major reference and research libraries, general business services and other media, but also to individuals engaged in all forms of research… For example, the services could be put to invaluable use by government agencies engaged in social research, scholars preparing such major documents as doctoral dissertations, general business services conducting research in specific areas for various clients, journalists marshalling material for books and articles.
Ivan Veit, VP of The Times, March 1969.
The Times presented further justification for their project publicly in an editorial published on August 9, 1969. It begins by linking the then-recent lunar landing on July 20 to the Information Bank and its technological achievement in communications.
Today one can transmit a story so fast that the record of an event is instantaneous if not simultaneous with the event itself. The speed and diversity of communications have overwhelmed the world with reportage, so facilities have had to be devised and techniques developed for handling, storing and retrieving the vast proliferation of current events data to provide a means of bringing some order to the chaos of information and the possibility of reflecting on what it all means.
…[T]he automated information bank… will put the recorded events within instant reach, but it will be up to the human researcher to grasp them.
Editorial, “Reaching for the Record,” August 9, 1969, The New York Times.
IBM performed the programming for the retrieval system (132 person-months[54]) which ran on IBM hardware. The Information Bank was operational by the Fall of 1972. New York Magazine included the Information Bank in Chris Welles’s profile of The Times from 1972.
…[A] student anywhere in the United States interested in the Cambodian incursion, or in what else was happening on the day Lincoln was shot, could simply step into his local university library to converse with the computerized morgue by means of a coaxial umbilical cord direct to New York…
The Times cannot be accused of thinking small. The information seeker would be able to talk to this deus ex machina of information in plain ordinary English—no intricate programming language like BAL, PL 1 , or COBOL would be necessary.
Chris Welles, “Harder Times at ‘The Times’”, New York Magazine, January 17, 1972.
The natural language interface was important to the project, and The Times likened it to consulting with a librarian. To the reporters who first used the system, however, something was lost in translation. This loss was best captured in Welles’ New York Magazine story.
As to the reporters/writers, it is hard to find a good word for the new venture among them. The system is being designed by technicians who aren’t newspapermen, and there is a great fear of loss of the serendipity factor. Going through clippings by hand often leads to unexpected results (one of my best articles came from an ad on the back of a clipping).
Chris Welles, “Harder Times at ‘The Times’”, New York Magazine, January 17, 1972.
Aside from the loss of serendipity and surprise from the physical representation of clippings as clippings, Welles further wondered whether it would even be possible to cross-index obscure recollections from reporters searching for specific events.
On April 30, 1969, the Information Bank’s principal advocates and visionaries at The Times, Dr. John Rothman, director of information services, and Mr. Robert November, director of the library services and information division, testified before a subcommittee of the House of Representatives. The hearings had to do with HR 8809, “a bill to amend Title IX of the National Defense Education Act of 1958 to provide for the establishment of a national information retrieval system for scientific and technical information.”[55] The meeting was largely informational, to help the subcommittee members better understand the challenges in creating such an ambitious system and its costs.
While the members of the subcommittee expressed admiration for what the Information Bank was attempting to do, there were questions. Some had to do with its anticipated high price, others with the underlying data. Here is an exchange between Hon. Roman Pucinski, the representative from Chicago presiding over the meeting—and Dr. Rothman. (For reference, this discussion is taking place between The Times’ announcement of the Information Bank in March of 1969 and its editorial on August of 1969 referencing the Apollo lunar landing.)
Mr. Pucinski: I want to make one observation, that the New York Times of 1969 is a far cry from that of 1920. I once came across an editorial in my research on the New York Times in 1920 in which it was suggested that Dr. Goddard be fired. In effect, the editorial called him an imbecile. It stated that anyone who would suggest a rocket can be launched out of the force of gravity and then propel itself into outer space and around the moon must be completely out of his mind, and any further expenditures on that kind of project is just a waste of taxpayers’ money.
That was a very fine editorial in the New York Times in 1920. I am very happy to know in 1969 there is considerably different thinking at the New York Times.
Dr. Rothman: May I respond to that? I have been asked by someone—and I don’t know whether he was trying to be funny or whether he was being incredibly naive—whether in this system we are going to go back and correct incorrect material.
The answer is no.
U.S. Congress, House, Committee on Education and Labor, National Science Research Data Processing and Information: Hearings before the General Subcommittee on Education, 91st Cong., 2nd sess., 1969.
“The speed and diversity of communications”—When AI Learns to Discover Stories
The New York Times imagined the Information Bank both helping reporters with historical research as well as to “bring some order to the chaos” of the volume of near real time events. The archive was transformed into a computational object, indexed and categorized, growing and becoming richer with time. It would move out from The Times headquarters on 43rd Street and out to libraries and universities across the country. It was a bold vision for 1969.
With the development of social media, we now truly have access to a seemingly never-ending stream of commentary and observations. Topics emerge and fade, changing over time, from country to country, and from city to city. But in this stream are indications of news events, broken out by time and location. Even Google searches respond quickly enough to certain classes of new material that they can be used to help in (near) real time reporting—a Google News search for the term “police involved shooting” was the basis for independent projects[56][57] attempting to come up with more realistic counts of the number of people killed by police than those reported by the FBI or the Centers for Disease Control.
One class of application of AI to journalism involves story discovery from platforms like Twitter and Instagram—“social media events monitoring.” Tools like dataminr, Newswhip and Reuters’s News Tracer all attempt to distill important events from streams of posts. The difficulty is in determining what is newsworthy and, given our current information ecosystem, what is likely true and not “fake.” News Tracer makes use of AI trained to “mimic human judgement” when poring over Twitter posts. A similar, earlier project, CityBeat[58] from CornellTech, attempted to identify newsworthy events from Instagram instead.
The CityBeat team admitted that “one of the main challenges while developing their project was in translating into algorithm the notion of a newsworthy event.” Part of the problem stemmed from reliance on the volume of posts in a geographic region as a predictor of an event taking place. They termed the problem “popularity bias”—whereas local news “focuses on small, exclusive small-scale stories,” CityBeat would respond to events that a large group of people found worthy of sharing on Instagram. A pillow fight might outrank a house fire. To get around this, the team introduced a post-processing step to their algorithm that relied on human judgment—they used Amazon’s Mechanical Turk, asking human raters to decide which of the identified events were truly newsworthy. (Recall The Times editorial’s insistence that despite automation, interpretation will be up to the human researcher.) The CityBeat team wanted the consensus of human judgment to train its algorithm.
This step came with its own set of problems. Not only did the team find that different newsrooms had their own definitions of newsworthiness, but the introduction of “novice” editors via Mechanical Turk was also not well received. They were said to lack “journalistic intuition” and, in the end, the CityBeat team used these ratings simply as another signal they passed along to the newsroom as part of the tool’s output.
CityBeat began in 2013 as a tool for “hyper-local aggregation” of social media posts, semi-automating the way journalists scan social media for signals of breaking news. From the moment journalists took to social media—identifying what’s happening, who to talk to, finding facts about an incident—there have been concerns about how to verify what they found. But with the lead up to the 2016 election and its coordinated misinformation campaigns, everyone worries about attempts to mislead machine-sourced news.
Full Fact has developed a database of “fact checks” and routinely scans media for claims that match them. According to a recent Poynter article,[59] they have also created “‘robo-checks’ that automatically match statistical claims with official government data. In May of this year Full Fact announced that it—along with Chequeado, Africa Check and the Open Data Institute—won a Google.org grant” of $2 million to use “AI to partially automate fact-checking.”
Poynter quotes a Full Fact press release: “In three years, we hope our project will help policymakers understand how to responsibly tackle misinformation, help internet platforms make fair and informed decisions and help individual citizens know better who and what they can trust,” it says. The project plans to develop tools for non-English speaking communities, a notorious gap in the development of natural language applications.
Clearly, questions of selection (Which clippings are included in a file? Which events are “newsworthy”?) and inclusion (Who makes these decisions?) and verification (Did this really happen?) are as critical in 2019 as in 1969.
1972—All the news that [was once] fit to print
Part of the frustration with the Information Bank came from its indexing, which depended on a thesaurus of searchable terms. While extensive, the thesaurus did not include “newly coined jargon, slang, acronyms or technical terms… [T]he reporters especially were frustrated when they could see these words in abstracts but could not use them as search terms.”[60] In short, the Information Bank did not support free text searching. This made quality indexing all the more important. But, as reporters at The Times worried, this important “abstracting” was being done by “hired hands” outside the newsroom.
Another perhaps more serious critique of the Information Bank came not from its organization but from the nature of the archive itself. The morgue, after all, was made up of reports of events which were, in turn, the product of human editorial choices at The Times. Given the page constraint of the paper, not every event occurring on a given day could be included. If the Information Bank became a crucial part of research at libraries and universities it was feared that
“…The Times could easily become an even more powerful arbiter of history than it now is. For too many researchers, what isn’t in the Bank simply won’t have happened.”
Erik Sandberg-Diment, “All the News That’s Fit to Print Out”, New York Magazine, January 17, 1972.
Weizenbaum went farther (much farther) and declared the Information Bank was, in fact, destroying history.
The computer has thus begun to be an instrument for the destruction of history… The New York Times has already begun to build a “data bank” of curated events. Of course, only those data that are easily deliverable as by-products of typesetting machines are admissible to the system. As the number of subscribers to the system grows, and as they learn more and more to rely on “all the news that [was once] fit to print,” as the Times proudly identifies its editorial policy, how long will it be before what counts as fact is determined by the system, before all other knowledge, all memory, is simply declared illegitimate?
Joseph Weizenbaum, Computer Power and Human Reason, 1976.
The Information Bank did not have any serious competition in the “online newspaper business” until 1976 when the Boston Globe and MTL sought to create their own text editing and retrieval system.[61] Development on The Times project continued until the early 1980s, with Dr. Rothman even pitching an expansion into a collection of statistical databases. The Information Bank came to an official end in 1983, and the clippings that had been indexed and digitized were repackaged and sold to Mead—owner of the then-separate Lexis and Nexis databases.
As an enactment of Weizenbaum’s warning about the Information Bank’s threat to history, The Times itself then seemed to simply erase the Information Bank effort from its own history.
The Information Bank apparently lost the battle of the bottom line, experiencing losses in every year except one after it became a commercial venture, and consuming a reported $20 million investment… The Times then appeared to forget that this pioneering service, one of their most ambitious most expensive, and most visionary outreach projects ever existed. A recent book published by the Times about its history over its entire life span included not a single word about the Information Bank or its fourteen years of very visible public activity…
Bourne, Charles P. and Hahn, Trudi B. A History of Online Information Services 1963-1976, 2003.
Conclusion
We rely on journalism to stay informed about “what’s on” in the world. But even in a simple statement like that, there is a lot to examine. What do we recognize as an event? How and who decides if it is newsworthy? Who sees our reporting and in what form? How do we trust the people narrating? Journalism is a complex cultural package. It gets even more complex when humanly-designed and deployed machines are added to the mix—machines which are capable of scaling journalistic work, extending our reporting capabilities, and optimizing tasks like distribution and personalization. They are powerful in image and deed, but these learning systems are ultimately the result of human effort and human decision making. In short, they are far from objective partners and arise from technical cultures with different values.
The slant story told here reminded us of this fact, casting a computer system as an “elaborator of human-scale acts.” We followed a news organization attempting to literally become a “newspaper of record” by extending its audience to include not only the reading public but machines as well. This story continues in the present day when the “human-scale acts” are often overshadowed by machine-scale acts, and when news becomes data involuntarily, every day. No external force called “AI” shapes journalism against its will. In newsrooms, reporters and developers react to the inevitable shifts that machine learning and AI enable, but adapting century-old working habits and organizational structures is always a rocky process.
As AI and machine learning take their place in the newsroom, we rehearse experiences from countless other professions who have faced the effects of digitization and computation—from business to law and the humanities. Remembering that these learning systems are ultimately human inventions, we reckon that journalists need to continue to develop their technical skills to become better tool makers rather than tool users. It is in this way that we control, we shape, our relationship to AI and can perhaps create an entirely new technical form, replete with our profession’s ethics and values.
Acknowledgements
We would like to thank Samuel Thielman, Charles Berret and Priyanjana Bengani for insightful comments and careful edits. Laura Kurgan, Michael Krisch and Juan Saldarriaga were invaluable inspirations as our story unfolded. Finally, we owe a significant debt to Jeff Roth from The New York Times’ morgue, who helped us research the significant technological innovations taken up by The Times and IBM in both their exhibition at the 1964 World’s Fair and the eventual design and deployment of the Information Bank.
Bibliography
Anderson, Christopher W. Apostles of Certainty. Oxford: Oxford University Press, 2018.
Anderson, Christopher W.; Bell, Emily & Shirky, Clay. “Post-Industrial Journalism: Adapting to the Present.” Tow Center For Digital Journalism (2012): 17.
Angwin, Julia; Larson, Jeff; Mattu, Surya & Kirchner, Lauren. “Machine Bias,” ProPublica, May 23, 2016.
Blankespoor, Elizabeth. “Capital market effects of media synthesis and dissemination: evidence from robo-journalism.” Review of Accounting Studies 23, no. 1 (March 2018): 1-36.
Bourne, Charles P. and Hahn, Trudi B. A History of Online Information Services, 1963-1976. Cambridge, M.A.: MIT Press, 2003.
Boylan, James R. Pulitzer’s School: Columbia University’s School of Journalism, 1903-2003. New York: Columbia University Press, 2003.
Brieman, Leo. “Statistical Modeling: The Two Cultures (with comments and a rejoinder by the author).” Statistical Science 16, no. 3 (2001): 199-231.
Brown, Pete. “Facebook struggles to promote ‘meaningful interactions’ for local publishers, data shows. Columbia Journalism Review, 2018.
Chammah, Maurice & Hansen, Mark. “Policing the Future,” The Marshall Project, February 3, 2016.
Cohn, Nate. “Live Polls of the Midterm Elections,” The New York Times. September 6, 2018.
Diakopoulos, Nicholas. Automating the News: How Algorithms Are Rewriting the Media. Cambridge, M.A.: Harvard University Press, 2019.
Etim, Bassey. “The Times Sharply Increases Articles Open for Comments, Using Google’s Technology.” The New York Times, June 13, 2017.
Fisher, Sarah. “NYT dropping most social media trackers,” Axios Media Trends, November 19, 2019.
Funke, Daniel. “These fact-checkers won $2 million to implement AI in their newsrooms.” Poynter.org, May 10, 2019.
Lippmann, Walter. “Elusive Curves.” The Boston Globe, April 13, 1935.
———. Liberty and the News. Princeton, NJ.: Princeton University Press, 2008.
Marconi, Francesco; Siegman, Alex & Machine Journalist. “The Future of Augmented Journalism: A guide for newsrooms in the age of smart machines.” Associated Press white paper, 2018.
Meyer, Philip. Paper Route: Finding My Way to Precision Journalism. Bloomington, IN: iUniverse, 2012. Pp. 192-201.
———. Precision Journalism: A Reporter’s Guide to Social Science Methods. Bloomington, IN: Indiana University Press.
Minsky, Marvin L. “Some Methods of Artificial Intelligence and Heuristic Programming.” In National Physical Laboratory. Mechanisation of Thought Processes I (London, 1959): 3-28.
Nerone, John. Media and Public Life. Cambridge, UK: Polity, 2015. P. 172.
Parrucci, Jennifer. “Metadata and the Tagging Process at The New York Times.” IPTC.org blog, March 14, 2018.
Pierce, Olga & Allen, Marshall. “Assessing surgeon-level risk of patient harm during elective surgery for public reporting,” ProPublica white paper, August 4, 2015.
Pulitzer, Joseph. “The College of Journalism,” North American Review 178, no. 570 (May 1904): 641-80.
Ribeiro, Marco Tulio; Singh, Sameer; & Guestrin, Carlos. “‘Why Should I Trust You?’: Explaining the Predictions of Any Classifier.” In: Proceedings of the 22nd ACM SIGKDD International Conference on Knowledge Discovery and Data Mining, ACM (KDD ’16): 1135-1144.
Rogers, Simon; Schwabish, Jonathan & Bowers, Danielle. “Data Journalism in 2017.” Google News Lab report. September 2017.
Rose, Tony; Stevenson, Mark & Whitehead, Miles. “The Reuters Corpus Volume 1 – from Yesterday’s News to Tomorrow’s Language Resources.” Reuters Technology Innovation Group report, 2002.
Schudson, Michael. “Political observatories, databases & news in the emerging ecology of public information.” Daedalus 139, no. 2 (Spring 2010): 100-109.
Schwartz, R., Naaman M., Teodoro R. “Editorial Algorithms: Using Social Media to Discover and Report Local News.” The Ninth International AAAI Conference on Weblogs and Social Media (ICWSM, May 2015).
Spangher, Alexander. “How Does This Article Make You Feel?” Times Open, October 31, 2018.
Stein, Jesse Adams. “Eames Overload and the Mystification Machine: The IBM Pavilion at the 1964 New York World’s Fair”. Seizure 2 (2011).
Stray, Jonathan. “Making Artificial Intelligence Work for Investigative Journalism.” Digital Journalism, (January 2019).
Student. “The Probable Error of a Mean,” Biometrika 6, no. 1 (March 1908): 1–25.
Wang, Shan. “BuzzFeed’s strategy for getting content to do well on all platforms? Adaptation and a lot of A/B testing,” Nieman Lab, September 15, 2017.
Wang, Sheng-Yu; Wang, Oliver; Owens, Andrew; Zhang, Richard; Efros, Alexei A. “Detecting Photoshopped Faces by Scripting Photoshop.” CoRR abs/1906.05856 (2019).
Weizenbaum, Joseph. Computer Power and Human Reason. New York: W.H. Freeman & Co., 1976.
Weizenbaum, Joseph. “ELIZA: A ComputerProgram For the Study of Natural Language Communication Between Man And Machine.” Communications of the ACM. 9, no. 1 (January 1966): 36-45.
Zhang, Amy X.; Ranganathan, Aditya; Metz, Sarah Emlen; Appling, Scott; Sehat, Connie Moon; Gilmore, Norman; Adams, Nick B.; Vincent, Emmanuel; Lee; Jennifer 8; Robbins; Martin; Bice, Ed; Hawke Sandro; Karger, David & Mina, An Xiao. “A Structured Response to Misinformation: Defining and Annotating Credibility Indicators in News Articles,” in: WWW ’18 Companion Proceedings of the The Web Conference 2018, 603-612.
Zellers, Rowan; Holtzman, Ari; Rashkin, Hannah; Bisk, Yonatan; Farhadi, Ali; Roesner, Franziska & Choi, Yejin. “Defending Against Neural Fake News.” CoRR abs/1905.12616 (2019).
Citations
[1] Christopher W. Anderson, Emily Bell & Clay Shirky, “Post-Industrial Journalism: Adapting to the Present.” Tow Center For Digital Journalism (2012), 17.
[2] Ibid.
[3] Boylan, James R. Pulitzer’s School: Columbia University’s School of Journalism, 1903-2003. (New York: Columbia University Press, 2003), 56-59.
[4] Michael Schudson, “Political observatories, databases & news in the emerging ecology of public information.” Daedalus 139, no. 2 (Spring 2010), 100-109.
[5] John Nerone, Media and Public Life (Cambridge, UK: Polity, 2015), 172.
[6] Walter Lippmann, Liberty and the News (Princeton, NJ.: Princeton University Press, 2008), 45.
[7] Walter Lippmann, “Elusive Curves.” The Boston Globe, 13 April 1935,17.
[8] Philip Meyer, Precision Journalism: A Reporter’s Guide to Social Science Methods. (Bloomington, IN: Indiana University Press, 1973).
[9] Philip Meyer. Paper Route: Finding My Way to Precision Journalism. (Bloomington, IN: iUniverse, 2012), 192-201.
[10] Christopher W. Anderson, Apostles of Certainty. (Oxford: Oxford University Press, 2018), 99-100.
[11] Jesse Adams Stein, “Eames Overload and the Mystification Machine: The IBM Pavilion at the 1964 New York World’s Fair”. Seizure 2 (2011).
[12] The Guardian: “The Counted” database. URL: https://www.theguardian.com/us-news/series/counted-us-police-killings
[13] Sarah Stillman, “When Deportation is a Death Sentence,” The New Yorker, January 8, 2018. URL: https://www.newyorker.com/magazine/2018/01/15/when-deportation-is-a-death-sentence
[15] Simon Rogers et al. “Data Journalism in 2017.” Google News Lab report. September 2017. URL: https://newslab.withgoogle.com/assets/docs/data-journalism-in-2017.pdf
[16] Leo Brieman, “Statistical Modeling: The Two Cultures (with comments and a rejoinder by the author).” Statistical Science 16, no. 3 (2001): 199-231.
[17] Kevin Quealy & Josh Katz, “Nike Says Its $250 Running Shoes Will Make You Run Much Faster. What if That’s Actually True?”, The New York Times, July 18, 2018. URL: ““https://www.nytimes.com/interactive/2018/07/18/upshot/nike-vaporfly-shoe-strava.html
[18] Marco Tulio Ribeiro, Sameer Singh, and Carlos Guestrin, “‘Why Should I Trust You?’: Explaining the Predictions of Any Classifier.” In: Proceedings of the 22nd ACM SIGKDD International Conference on Knowledge Discovery and Data Mining, ACM (KDD ’16): 1135-1144.
[19] Olga Pierce & Marshall Allen, “Assessing surgeon-level risk of patient harm during elective surgery for public reporting,” ProPublica white paper, August 4, 2015. URL: https://static.propublica.org/projects/patient-safety/methodology/surgeon-level-risk-methodology.pdf
[20] Buzzfeed’s codebase for “Spies in the Skies” https://buzzfeednews.github.io/2017-08-spy-plane-finder/
[21] The Marshall Project’s data https://github.com/themarshallproject/city-crime and FiveThirtyEight’s codebase https://github.com/fivethirtyeight/data/tree/master/subreddit-algebra
[22] Nate Cohn, “Live Polls of the Midterm Elections,” The New York Times. September 6, 2018. URL: https://www.nytimes.com/2018/09/06/upshot/midterms-2018-polls-live.html
[23] Jonathan Stray, “Making Artificial Intelligence Work for Investigative Journalism.” Digital Journalism, (July 2019).
[24] SRCCON 2018 session: Regression in the newsroom: When to use it and thinking about best practices. URL: https://2018.srccon.org/sessions/#proposal-stats-newsroom
[25] “Inside IBM’s World’s Fair `Egg’”. Popular Science. July, 1964.
[26] New York World’s Fair, IBM Computer Application Area memo. URL: https://www.worldsfairphotos.com/nywf64/documents/ibm-computer-applications-area.pdf
[27] “The Fair? Sure, We’re There.” Times Talk, April 1964.
[28] Ibid. 8.
[29] Jennifer Parrucci, “Metadata and the Tagging Process at The New York Times.” IPTC.org blog, March 14, 2018. URL: https://iptc.org/news/metadata-and-the-tagging-process-at-the-new-york-times/
[30] Shan Wang, “BuzzFeed’s strategy for getting content to do well on all platforms? Adaptation and a lot of A/B testing,” Nieman Lab, September 15, 2017. URL: https://www.niemanlab.org/2017/09/buzzfeeds-strategy-for-getting-content-to-do-well-on-all-platforms-adaptation-and-a-lot-of-ab-testing/
[31] Sarah Fisher, “NYT dropping most social media trackers,” Axios Media Trends, November 19, 2019. URL: https://www.axios.com/newsletters/axios-media-trends-a189a865-c7ed-4a0a-86ca-7182692eb74f.html?chunk=3&utm_term=twsocialshare#story3
[32] Alexander Spangher, “How Does This Article Make You Feel?” Times Open, October 31, 2018. URL: https://open.nytimes.com/how-does-this-article-make-you-feel-4684e5e9c47
[33] Pete Brown, “Facebook struggles to promote ‘meaningful interactions’ for local publishers, data shows. Columbia Journalism Review, 2018. URL: https://www.cjr.org/tow_center/facebook-local-news.php
[34] Bassey Etim, “The Times Sharply Increases Articles Open for Comments, Using Google’s Technology.” The New York Times, June 13, 2017. https://www.nytimes.com/2017/06/13/insider/have-a-comment-leave-a-comment.html?module=inline
[35] Tony Rose et al. “The Reuters Corpus Volume 1 – from Yesterday’s News to Tomorrow’s Language Resources.” Reuters Technology Innovation Group report, 2002. URL: https://pdfs.semanticscholar.org/3e4b/dc7f8904c58f8fce199389299ec1ed8e1226.pdf
[36] GenderMeme. URL: https://gendermeme.org/
[37] Stanford Cable TV News Analyzer. URL: https://esper-tv.stanford.edu/
[38] Francesco Marconi et al. “The Future of Augmented Journalism: A guide for newsrooms in the age of smart machines.” Associated Press white paper, 2018.
[39] Elizabeth Blankespoor. “Capital market effects of media synthesis and dissemination: evidence from robo-journalism.” Review of Accounting Studies 23, no. 1 (March 2018): 1-36.
[40] Amy X. Zhang et al. “A Structured Response to Misinformation: Defining and Annotating Credibility Indicators in News Articles,” in WWW ’18 Companion Proceedings of the The Web Conference 2018, 603-612.
[41] Sheng-Yu Wang et al. “Detecting Photoshopped Faces by Scripting Photoshop.” CoRR abs/1906.05856.
[42] Rowan Zellers et al. “Defending Against Neural Fake News.” CoRR abs/1905.12616 (2019).
[43] https://github.com/jeffshrager/elizagen/tree/master/eliza/version
[44] Marvin L. Minsky, “Some Methods of Artificial Intelligence and Heuristic Programming.” In National Physical Laboratory. Mechanisation of Thought Processes I (London, 1959): 3-28.
[45] Joseph Weizenbaum, “ELIZA: A ComputerProgram For the Study of Natural Language Communication Between Man And Machine.” Communications of the ACM. 9, no. 1 (January 1966): 36-45.
[46] Nicholas Diakopoulos, “Algorithmic Accountability Reporting,” in: Automating the News: How Algorithms Are Rewriting the Media (Cambridge, M.A.: Harvard University Press, 2019).
[47] https://algorithmtips.org
[48] Julia Angwin, Jeff Larson, Surya Mattu & Lauren Kirchner, “Machine Bias,” ProPublica, May 23, 2016. URL: https://www.propublica.org/article/machine-bias-risk-assessments-in-criminal-sentencing
[49] Maurice Chammah & Mark Hansen, “Policing the Future,” The Marshall Project, February 3, 2016. URL: https://www.themarshallproject.org/2016/02/03/policing-the-future
[50] PredPol website URL: https://www.predpol.com/
[51] Risk Terrain Modeling website URL: https://www.riskterrainmodeling.com/
[52] Charles P. Bourne & Trudi B. Hahn, A History of Online Information Services, 1963-1976. Cambridge, M.A.: MIT Press, 2003.
[53] Ibid.
[54] Ibid.
[55] Hearings Before the General Subcommittee on Education, Ninety-First Congress, First Session on H.R. 8809, April 29 and 30, 1969. URL: https://archive.org/details/ERIC_ED060893/page/n371
[56] The Washington Post’s GitHub repository for their “Fatal Force” project in which they have been counting the number of fatal police shootings in the US since 2015 https://github.com/washingtonpost/data-police-shootings
[57] The Guardian: “The Counted” (captures police shootings in 2015 and 2016 only). https://www.theguardian.com/us-news/ng-interactive/2015/jun/01/the-counted-police-killings-us-database
[58] Raz Schwartz, Mor Naaman & Rannie Teodoro. “Editorial Algorithms: Using Social Media to Discover and Report Local News.” The Ninth International AAAI Conference on Weblogs and Social Media (ICWSM, May 2015).
[59]Daniel Funke, “These fact-checkers won $2 million to implement AI in their newsrooms.” Poynter.org, May 10, 2019. URL: https://www.poynter.org/fact-checking/2019/these-fact-checkers-won-2-million-to-implement-ai-in-their-newsrooms/
[60] Ibid. 39.
[61] Ibid. 39.
[62] Ibid.
Bernat Ivancsics and Mark Hansen study digital journalism at Columbia Journalism School. Bernat Ivancsics is a PhD candidate and focuses on the emergent trends of computational journalism. Mark Hansen is a Professor, and Director of the Brown Institute for Media Innovation.