Algorithms for automatically generating stories from machine-readable data have been shaking up the news industry, not least since the Associated Press started to automate the production and publication of quarterly earnings reports in 2014. Once developed, such algorithms can create an unlimited number of news stories for a routine and repetitive topic—faster, cheaper, and with fewer errors than any human journalist ever could. Within the “Computational Campaign Coverage” research project, researchers teamed up with the German-based software company AX Semantics to develop automated news based on forecasting data for the 2016 U.S. presidential elections. The data was provided by the PollyVote research project, which also hosted the platform for the publication of the resulting texts. The process of generating the news was completely automated, from collecting and aggregating the forecasting data, to exchanging the data with AX Semantics and generating the texts, to publishing those texts at pollyvote.com. Over the course of the project, nearly 22,000 automated news articles were published in English and German. The project built on the prior work published in the “Guide to Automated Journalism.”1 This guide provided an overview of the state of automated journalism based on interviews and a review of the literature. The goal of the “Computational Campaign Coverage” project was to conduct our own primary research to gain firsthand experience around the potentials and limitations of automated journalism. The project’s key learnings can be summarized as follows:
Multilingual texts, as well as texts based on a single row in the dataset, are easy to automate. Adding additional insights quickly increases complexity at a level that is difficult to manage. Because of the fully automated process, the rate of errors in the final texts was high. Most errors occurred due to errors in the source data. Efforts for quality control, troubleshooting, and onboarding were higher than expected. It’s difficult to develop a “one-fits-all” algorithm for different story types. Contextual knowledge is a boundary of automation that is reached quickly.
In addition to developing automated news, the project team also conducted an online experiment to study how news consumers perceive the quality of the generated texts (specifically regarding their credibility and readability) and how these quality perceptions depend on various levels of algorithmic transparency.2
Download a PDF of the full report here.
Introduction
Before embarking on the “Computational Campaign Coverage” research project, I wrote the “Guide to Automated Journalism,” which was published in January 2016.3 The guide summarized the status quo of automated news generation, raised key questions for future research, and discussed the technology’s potential implications for journalists, news consumers, media outlets, and society at large. I found that, despite its potential, the technology is still in an early-market phase. Automated news generation is limited to routine and repetitive topics for which (1) clean and accurate data is available and (2) the stories merely summarize facts, therefore (3) leaving little room for uncertainty and interpretation. Popular examples include recaps of lower-league sports events, financial news, crime reports, or weather forecasts. For such topics, research finds little difference in people’s relative perception of human-written and automated news.4 Also, due to the low-involvement nature of these topics, readers may be less concerned about issues regarding algorithmic transparency and accountability. The “Guide to Automated Journalism” provides a valuable overview of the state of automated journalism. It received wide international media attention, was mentioned in the Future Today Institute’s “2017 Tech Trend Report,” and is widely cited in academic literature. I was also invited to present the guide at the International Journalism Festival in Perugia, the ONA16 in Denver, the Munich Media Days, a forum on digital humanities in Brussels, and at the Associated Press’s headquarters in New York City. The guide was well received among researchers, practitioners, and the media alike. However, it provided information based on a review of the literature and of what others have done. The research team behind “Computational Campaign Coverage” felt that we would gain additional knowledge and firsthand experience around the potentials and limitations of automated journalism if we developed our own text-generating algorithms. We thus embarked on the research project that follows. The project aimed to study the creation of automated news for forecasts of the 2016 U.S. presidential election, based on data from the forecasting platform pollyvote.com. In addition, the resulting texts provided the stimulus material for studying the consumption of automated news for a high-involvement topic that involves uncertainty. This project report provides an overview of this research effort by describing the underlying data and the process of generating the automated news. It then outlines important lessons we learned and lists the project’s output.
The PollyVote
The PollyVote.com research project was founded in 2004 to demonstrate advances in forecasting methodology for the high-profile application of U.S. presidential election forecasting. Across the three elections from 2004 to 2012, PollyVote’s final forecast missed the national popular vote by only about half a percentage point on average. In comparison, the respective error of the final Gallup poll was more than three times higher. The PollyVote’s performance is even more impressive for long-term forecasts, when polls are only of limited value. Since 2004, the PollyVote has correctly predicted the popular-vote winner months in advance and more accurately than any other method.5
Combining Forecasts
PollyVote applies evidence-based forecasting principles and relies on the principle of combining forecasts, which has a long history in forecasting literature and is well established as a powerful method for reducing forecast error. Combining forecasts increases accuracy both because the approach allows for including more information and cancels out bias of individual methods. While combining is useful whenever more than one forecast is available, the approach is particularly valuable if (1) many forecasts from evidence-based methods are available, (2) the forecasts draw upon different methods and data, and (3) there is uncertainty about which method is most accurate. These conditions apply to election forecasting. First, there are many evidence-based methods for predicting election outcomes. While most people may think of polls as the dominant method for forecasting elections, asking people for whom they are going to vote is among the least useful methods, except shortly before Election Day. One usually gets much more accurate forecasts by asking about people’s expectations rather than their intentions. This can be done by simply asking citizens to select the candidate they think is going to win, or letting people bet on the election outcome and using the resulting odds as forecasts. Another useful approach is to develop quantitative forecasting models based on theories of voting and electoral behavior. For example, so-called political economy (or econometric) models rely on the idea of retrospective voting, which assumes that voters reward the incumbent party for good—particularly economic—performance and punish it otherwise. Index models assume voters think prospectively, for example, by assessing which candidate they think would do a better job in handling the issues or leading the country. Since all these methods rely on different data, election forecasting meets the second condition for which combining is most beneficial. Finally, in most situations it is difficult to determine a priori which method will provide the best forecast, particularly if the election is still far away. The reason is that every election is held in a different context and has its idiosyncrasies. Therefore, methods that worked well in the past may not necessarily work well when predicting future elections. For example, while prediction (or betting) markets were among the most accurate methods for forecasting the U.S. presidential elections from 1992 to 2008, they did not do well the two most recent elections. As shown in Figure 1, the PollyVote harnesses the benefits of combining under these ideal conditions by averaging forecasts within and across different methods, namely polls, prediction markets, expert judgment, citizen forecasts, econometric models, and index models.
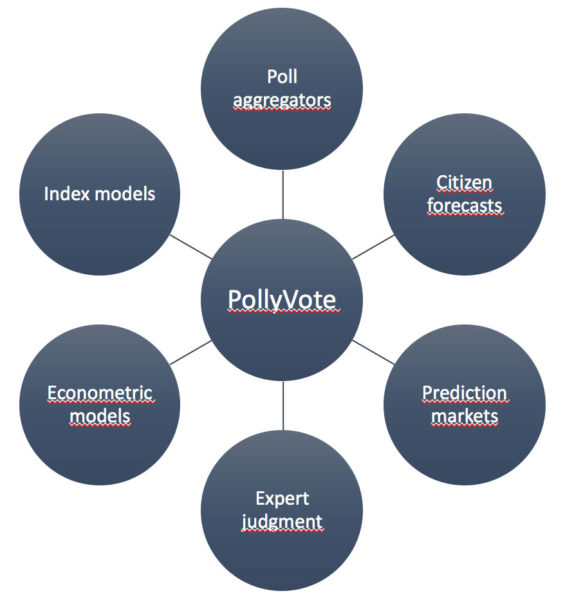
Figure 1: PollyVote method of combining forecasts.
2016 Forecast
Since its first launch in January of 2016, the combined PollyVote forecast consistently—and correctly—predicted that Hillary Clinton would win the popular vote.1 However, with a MAE of 1.9 percentage points across the last 100 days before the election, the forecast error was almost twice as large as in previous elections (see Figure 2).
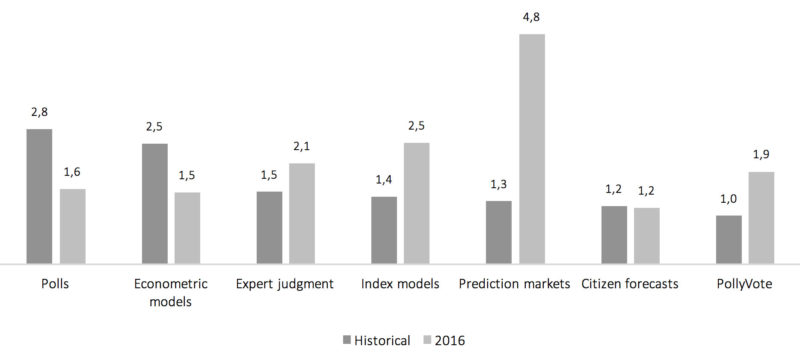
Figure 2: Forecast error by method (mean absolute error, historical versus 2016, across last 100 days before the election).
Prior research shows that the relative accuracy of different forecasting methods varies from one election to the next. We can see this again in 2016. Prediction markets—which were among the most accurate methods historically—were dramatically off, while econometric models—historically high in error—turned out to be more accurate this time. That is one of the reasons why combining forecasts usually works well. It’s extremely difficult to predict ex ante which method will end up being most accurate. Combining works best when the various component forecasts bracket the true value. Compared to the previous six elections, there wasn’t much bracketing in 2016. Five of the combined forecasts overshot Clinton’s share of the vote, while only one component, the econometric models, fell short. Thus, the PollyVote did not do as well as in previous elections and performed only slightly better than the typical forecast. That is, it performed worse than econometric models, citizen forecasts, and polls, but outperformed expert judgment, index models, and prediction markets. But the principle of combining forecasts makes no claim that the combined forecast will always outperform its most accurate component, although that can happen, as was the case in 2004 and 2012. The claim that is made is that over time, as the component methods’ relative accuracy varies, the PollyVote will surpass its components. This is demonstrated in Figure 3, which displays the mean absolute error of all methods across all seven elections from 1992 to 2016. On average, the PollyVote continues to minimize error while avoiding making large errors.6
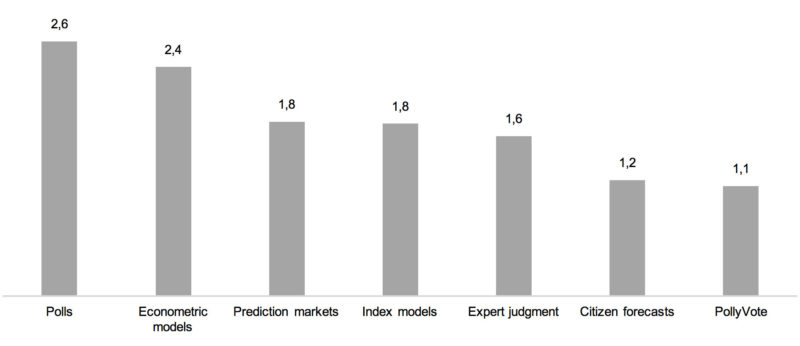
Figure 3: Forecast error by method (mean absolute error, 1992–2016, across last 100 days before the election).
Automated News
Data
To generate automated news from data, the first step is to ensure that the necessary data is available and of high quality. That is, the data needs to be accurate and complete. The PollyVote method and the underlying data are published in peer-reviewed scientific journals and are thus fully transparent and publicly available. Since the PollyVote incorporates all available forecasts in the combination, the dataset is extensive. For example, the data that was used to predict the 2012 election included nearly 8,000 individual, daily forecasts. Note, however, that this figure only refers to predictions at the national (popular-vote) level. If one also includes forecasts at the state level, which is what we did for the 2016 election, the dataset grows rapidly. Hence, this situation meets the conditions under which automation is most useful: if (a) there is good data available and (b) a large number of routine news stories need to be written.
API
To generate the automated news stories, we collaborated with the German company AX Semantics, which was responsible for developing the underlying algorithms. An initial challenge for our project meant developing an interface through which AX Semantics could automatically obtain the PollyVote data in a structured (i.e., machine-readable) format. To allow for this possibility, we developed an API that contained both historical and 2016 forecast data for the combined PollyVote, as well as its components at the national and state level. Access to the API was not limited to our project partner. Rather, to make our procedures fully transparent, we made our data publicly available at pollyvote.com. Interested users could obtain data by making requests to our web API. We also provided a generator tool to help new users easily construct request URLs. Details on the data, as well as instructions for how to obtain it, can be found at pollyvote.com.2
Automated Text Generation
Figure 4 shows the basic functionality of natural language generation. First, the software collects available data; in our case, this included polling data, candidate and party names, and historical data such as election results and forecasts. Second, algorithms employ statistical methods to identify important and interesting events in the data, such as defining when a poll is an outlier or when a candidate’s poll numbers are trending.
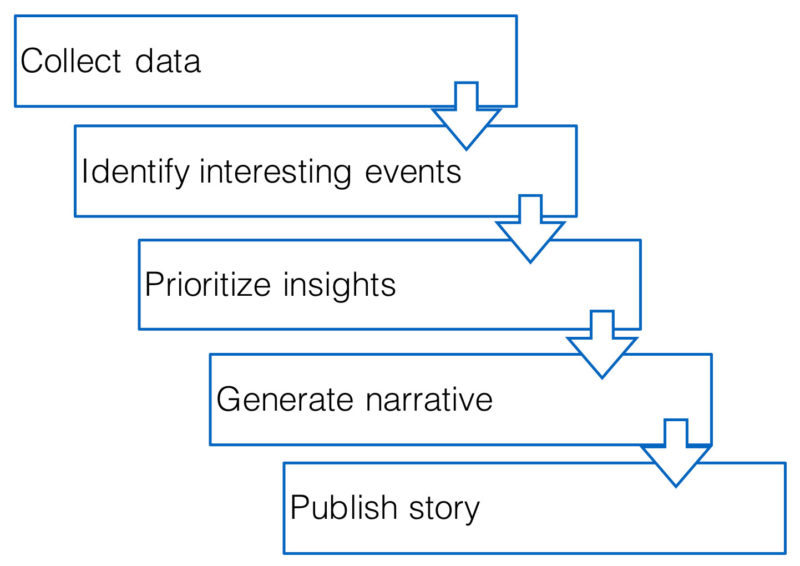
Figure 4: Process of automated news generation.
Third, the software classifies and prioritizes the identified insights by importance and, fourth, arranges the pre-written sentences by following pre-defined rules for inserting data and generating a narrative. Finally, the story can be uploaded to the publisher’s content management system, where it can be automatically published.
Example Text
From April to November 2016, we published a total of 21,928 automated posts in English and German. Figure 5 provides an excerpt of an automated news item that reports the results of a new poll. The article has been shortened from its original length of about 300 words. The colored highlighting shows the different types of data used in the automation process.
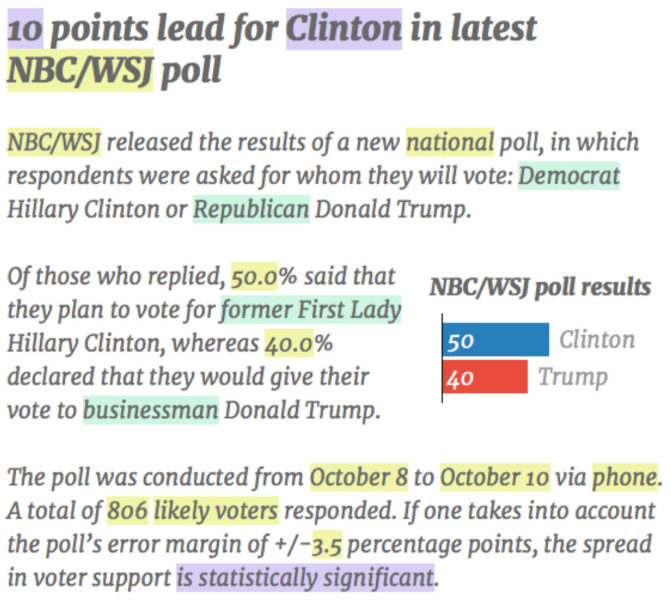
Figure 5: Example of automated news item.
The yellow highlighting shows data that is simply taken from the raw data and inserted into the text: the name of the poll, the candidate’s actual polling numbers, or other statistics such as the polling period, the sample size, or the margin of error. For a list of all data fields, see the API at pollyvote.com. The purple highlighting shows fields that are based on calculations with the raw data. For example, the algorithm derives from the data that (a) Clinton is ahead in the poll, (b) she is ahead by 10 points, and (c) this lead is statistically significant. Thus, the algorithm relies on a set of pre-defined rules. For example, the statement of whether a candidate’s lead in the poll is significant is based on whether the candidates’ poll numbers plus/minus the margin of error overlap. The green fields highlight sample synonyms, which are used to add variety to the text. For example, instead of simply saying “Democrat” Hillary Clinton, the algorithm randomly chooses from a list of synonyms (e.g., “Democratic candidate,” “the candidate of the Democratic party,” etc.), which we formulated as a team. Similarly, instead of using the expression “will vote,” the algorithm could use other expressions such as “intend to vote” or “plan to vote.” Furthermore, the project team wrote several variants for each sentence, of which the algorithm randomly choses one when generating the text. Adding synonyms for certain words/phrases and variants for sentences exponentially increases the number of possible variants for the whole text. For example, the short excerpt shown in Figure 5 could be written in about a million different ways. Thus, for any given input data, the algorithm is highly unlikely to generate the identical text twice. But the text’s general structure would remain the same, of course.
Complexity of the System
The text shown in Figure 5 is simple in that it only describes the results of a single poll. That is, the text only refers to a single row in the dataset. However, we also generated texts that compared the poll numbers to (a) the latest poll average, (b) previous results from the same poll, (c) historical polls from previous elections, and (d) forecasts from other methods (e.g., the combined PollyVote). For this, it was necessary to pull data from different sources and to compare them with each other. In addition, we generated similar texts for the remaining five PollyVote component methods, plus the combined PollyVote. The ability to cover different story types, and to compare forecasts both across time and across methods, dramatically increased the complexity of the system. The final system consisted of more than 150 sentences—most of which had three variants—which existed in two languages. That is, the total number of sentences stored in the system was close to 1,000. Furthermore, the system incorporated 442 properties. Simply put, properties are rules used to connect raw data to the text; for example, to define truth and mapping conditions, as well as which vocabularies to use when referring to certain data points.
Perceptions of Automated News
In addition to generating automated news, another goal of the project was to study how people perceive the quality of automated news (specifically its message and source credibility and readability), and how these quality perceptions depend on various levels of algorithmic transparency. For this, we collaborated with Tow Fellow Nick Diakopoulos, who is an expert in algorithmic transparency, to set up an online survey aimed at experimentally studying people’s perceptions by manipulating various degrees of transparency with the automated news. The survey was launched shortly before Election Day at Amazon Mechanical Turk. The results showed a negative relationship between message and source credibility and algorithmic transparency. As one would expect, algorithmic transparency had no effects on readability. While this may suggest that news outlets should be cautious about highlighting that their content was generated automatically, the results are limited due to the small number of experiment participants. Future research is necessary to contribute further evidence on the effect of algorithmic transparency on people’s perceptions. 7
Lessons Learned
This section summarizes some of the key lessons from the project.
Error Rates
Given the vast amount of news items, it was impossible to manually check the quality of each article. Thus, when we first deployed the system, we decided to automatically publish all generated articles. This meant that our news items would necessarily contain errors, which we would fix in the algorithm (but not in the published texts) as soon as either we—or visitors to our site—noticed them. This procedure enabled visitors to track how our algorithms developed over time, which we considered appropriate for a research project. We did not analyze the rate of errors per article, but we would expect it to be high, especially for articles published early on. The closer we came to Election Day, the more sophisticated and error-free the algorithms worked, and the fewer errors the texts contained. The most common errors were due to errors in the underlying data. The PollyVote automatically scraped data from a variety of websites, a process that is prone to error (e.g., if the target website was unavailable or the structure of the source data changed). Thus, some texts would not be generated due to filters for missing data, while others would be generated with errors until the errors were fixed.
Managing Complexity
Simple texts, such as the plain description of poll results (see Figure 5), were easy to automate since such texts are usually based on a single row in the data. However, adding additional insights often resulted in levels of complexity that were difficult to manage. Examples include the comparison of a poll’s results to results from other polls (or historical elections), or making statements about whether a candidate is trending in the polls. In such cases, the added complexity often increased the likelihood of new errors.
Multilingual Texts
Except for increasing the number of sentence variants, supporting two languages (English and German) did not greatly increase the complexity of the algorithm. In fact, this task was much easier than expected. The reason is that the underlying ruleset remains the same, regardless of the number of output languages. Simply put, once the algorithm has been defined in one language, one merely needs to translate the sentences into another language that the system already supports (at the time of writing, AX Semantics supports 18 different languages).
Maintenance Effort
We underestimated the efforts necessary for quality control and troubleshooting. Often, the development of new features or statements had to be delayed due to constant error fixing. One particular challenge was detecting the source of an error, since it could be in the raw data, within the data export/import, or in the algorithm itself. Thus, different people were involved in an unstructured error detection process (i.e., those responsible for the data collection and API development, as well as those working on the algorithms). Here, a technical solution that provides a systematic, issue-tracking system would have been helpful.
Quality Beats Quantity
The prospect of generating thousands of articles was enticing and motivating, and the development of the algorithms was fun. That said, it would have been wise to start out with a strong focus on quality rather than quantity. Our initial—and perhaps overly ambitious—goal was to quickly produce texts for all six-component methods, as well as the combined PollyVote forecast, each of which the system considered a different story type. To do that, we tried to make the algorithm as generic as possible. For example, we wanted to use the same sentence for many different story types. The problem was that this dramatically increased the complexity of the algorithm and the underlying code, which introduced errors. In addition, the high level of complexity made it difficult for us, the researchers, to make changes to the algorithms by ourselves. Instead, we needed the help of an AX programmer even for small adjustments. We eventually decided to take a step back and focus on one story type at a time. This is the reason why some story types, such as those on polls and the PollyVote forecast, are of better quality than others. In retrospect, we would recommend not aiming too high. Rather than developing a complex, “one-fits-all” solution, we should have worked on one story type at a time until an acceptable level of quality had been reached. As we learned over time, this could have avoided introducing the same mistakes in different story types.
Onboarding Efforts
We underestimated the challenges of working in an interdisciplinary team, and in collaboration among researchers and practitioners. While AX Semantics was extremely helpful, understanding, and always open to our suggestions and needs, we encountered an initial gap compared to our motivation and needs (e.g., errors-fixing on weekends). For example, AX Semantics needed time to completely understand how the PollyVote works, particularly the rather complex structure of the underlying data. Likewise, we had to learn how to use the software solution AX Semantics provided to allow us to work on the algorithms.
Boundaries of Automation
We reached the boundaries of automation faster than expected. When developing the algorithm’s underlying rules, we constantly faced questions, such as: How should we refer to the margin between candidates in polls? When does a candidate have a momentum? When is there a trend in the data? While such questions might be easy to answer for a human journalist, they are hard to operationalize and to put in pre-defined rules. The reason is that concepts such as lead, trend, or momentum, which are common in traditional campaign coverage, are not well defined and heavily depend on the context of the election. For instance, even for the most basic question of who is ahead in the polls, there are no clear guidelines for how to refer to the actual distance in polling numbers. When is a lead small or large? To come up with a ruleset for this question, we conducted a content analysis of how newspapers report polls, along with an expert survey. Needless to say, we did not have the resources for such a thorough approach for each decision we faced. Thus, many rules were simply formulated on the fly and based on our own judgment. In addition, even if it is possible to define rules based on prior analysis, the statements still seem to very much depend on the context and are thus subject to journalistic interpretation. For example, a four-point lead for Clinton a week before the election was considered normal, whereas a four-point lead for Trump would have been big news. In other words, understanding the context is extremely important for providing meaningful interpretation of the numbers. The journalistic freedom of interpretation provides a barrier that will be hard to overcome for algorithms, which need to rely on pre-defined rules.
Conclusion
In developing algorithms for covering forecasts of the 2016 U.S. presidential election, we aimed to gain firsthand experience around the potentials and limitations of automated journalism. The technology’s main benefit is obviously an economic one. Once an algorithm has been developed and validated, it’s possible to create an unlimited number of articles, in multiple languages, in virtually no time. Over the course of the project, we published a total of 21,928 news articles in English and German. This process was completely automated, from collecting and aggregating the forecasting data; to sending the data to AX Semantics, which generated the texts and sent them back to us; to publishing the content at pollyvote.com. The first steps in developing the algorithms are easy, particularly if the goal is to create texts based on a single row in the dataset. That said, adding additional insights tends to increase complexity and, thus, the likelihood of errors. Therefore, it is important to keep things simple and to establish processes for quality control and troubleshooting. Also, we found that pre-defined rules may not always be able to appropriately account for the idiosyncrasies of a particular context. Given the very successful project and partnership with AX Semantics, we have already moved on to the next project, in which we’re covering forecasts of the 2017 German federal election at www.pollyvote.de. Thereby, a particular focus will be on the question of how automated news can help us to better communicate the uncertainty surrounding the forecasts.
Acknowledgments
This work was funded by the Tow Foundation and the John S. and James L. Knight Foundation. Thanks to Mario Haim (LMU Munich) and Frank Feulner (AX Semantics) for the wonderful collaboration. Thanks to the Tow Center for the great support throughout the project, particularly to George King, Claire Wardle, and Kathy Zhang. Abigail Ronck edited the report.
Citations
- Andreas Graefe, “Guide to Automated Journalism,” Tow Center for Digital Journalism (Columbia Journalism School, New York) (2016).
- Andreas Graefe, Mario Haim, and Nicholas Diakopoulos, “Effects of algorith- mic transparency on perceptions of automated news,” presentation at the Annual Meeting of the International Communication Association, San Diego, CA, 2017.
- Graefe, “Guide to Automated Journalism.”
- Andreas Graefe et al., “Readers’ Perception of Computer-Written News: Credibility, Expertise, and Readability,” Journalism, 2016, https://doi.org/10. 1177/1464884916641269.
- Richard Powell Amnon Cavari and Kenneth Mayer, “Assessing the 2016 U.S. Presidential Election Popular Vote Forecasts,” in The 2016 Presidential Election: The Causes and Consequences of an Electoral Earthquake, ed. Richard Powell Amnon Cavari and Kenneth Mayer (Lanham, MD: Lexington Books, 2017).
- Ibid.
- Graefe, Haim, and Diakopoulos, “Effects of algorithmic transparency on perceptions of automated news.” Annual Meeting of the International Communication Association, San Diego, USA, May 25.29.
- Graefe, Haim, and Diakopoulos, “Effects of algorithmic transparency on perceptions of automated news.”