
Executive Summary
Whether it’s who is going to win an upcoming election, how a pandemic will unfold next month, or just what we plan to have for lunch, human beings are cognitively wired to think about—and want to know about—the future. Predictive journalism is a genre of data journalism focused on generating evidence-based forecasts that can help to fill this audience need. This report develops this idea of predictive journalism, describing and synthesizing observations from the domains of elections, covid, and beyond. Based on interviews with some of the genre’s key players as well as a content analysis of dozens of published examples, I elaborate on its journalistic value such as communicating predictions and explanations, enabling analysis through counterfactuals and critiques, and informing downstream news coverage, as well as describe how it works in practice in terms of interactivity, uncertainty communication, and transparency disclosure. I then argue for the development of a responsible journalistic practice of prediction, work toward articulating what that might entail, and make recommendations for how the field can further develop predictive journalism.
Key Takeaways
- Predictive journalism is defined as the incorporation of predictive information such as forecasts, nowcasts, hindcasts, or other estimates into news production processes (e.g., reporting, publication, distribution) by using or relying on computational modeling techniques such as machine learning and simulation.
- Predictive journalism can yield journalistic value in several dimensions, including communicating predictions and explanations of complex systems; enabling analysis, counterfactual thinking, and critique; and informing downstream news coverage by orienting reporting, helping find angles, or serving as the basis for analytic interpretation.
- In our corpus of predictive-journalism examples, the topic of prediction was dominated by politics (40 percent), including elections; health/science (39 percent), which was mostly composed of covid-related predictions; sports (11 percent); and other societal issues (6 percent). The application of predictive journalism is constrained by available data.
- Predictive journalism is frequently presented interactively and almost always includes some form of data visualization. Presentations of predictions are often accompanied by transparency information to help validate or caveat the methods and assumptions alongside uncertainty information to reflect the imperfect nature of predictive information.
- A responsible practice around predictive journalism can be developed by evaluating how uncertain predictions may influence users, ensuring their appropriate and accurate reception and interpretation, and developing rigorous editing protocols for sourcing and publishing predictions.
- To further advance the responsible practice of predictive journalism I recommend investing in user-centered evaluation, partnering with academic institutions, developing standards for vetting models prior to publication, researching other ways in which predictions shape internal workflows, and developing innovative practices that effectively leverage predictions as part of an interpretive and explanatory endeavor.
Introduction
The coronavirus pandemic has been and perhaps always will be the defining event of our lifetimes. For the past two years we’ve been through the anxiety of lockdowns, the heartbreak of missed holidays, the sadness of lives cut short, and the deeply unsettling politicization of it all. In the fog of uncertainty about what to do and of how to even be around other people, the news media helped guide us, imperfectly, as best it could according to what it knew. The news wasn’t only about what had happened or what was happening with the pandemic, but about what might come next: the next variant, the next wave and peak, and the prospects for a vaccine and maybe herd immunity. The media has served us in a fundamentally prospective role, and has done it—at least in part—using data-driven computational modeling to make predictions.1 Take, for instance, the New York Times’ early visualization of covid cases and death counts, which allowed readers to explore the potential impacts of different policy interventions,2 or, later, NPR’s projection of vaccination rates in the US and in individual states.3 In this report I refer to these initiatives as “predictive journalism,” a genre of data journalism focused on generating predictive information like forecasts using methods such as machine learning and computer simulation.
Human beings have a fundamental drive and need to think about the future.4 We engage in future-oriented cognition about our lives by setting goals, planning ways to reach those goals, and predicting or mentally simulating how things will be once we get there. As neuroscientist Dean Buonomano explains, “the brain makes decisions in the present, based on memories of the past, to enhance our well being in the future…the brain is at its core a prediction or anticipation machine.”5 Contemplating the future can also shape how we think and act now: imagining the scenario of a particular candidate winning an election can make it more likely to think that candidate will be elected.6 And how far into the future individuals think has been linked to their risk-taking and investing behavior.7 Given how important thinking about the future is to human experience—and survival, really—what is, or should be, the news media’s role in shaping the public’s thinking about it?
Culturally, journalism continues to exhibit an obsession with the present, with immediacy and what’s happening now.8 But this has been changing. Plenty of research now supports the idea that news content, while it certainly does emphasize the present, is a healthy blend of past, present, and future.9 A 2012 study of news content from the New York Times and the Los Angeles Times found that more than a quarter of news items referred to the “midrange” future, from about two days to six months out.10 By anticipating impacts and framing inchoate issues, journalists are already hopelessly involved in setting the stage for future thinking in their readers. And so, rather than accept the speculations of pundits, predictive journalism helps journalists embrace this role rigorously, offering an evidence-based approach grounded in data and computational methods.
But should journalists really make assertions about what they don’t know for sure? Since predictions are always wrapped in uncertainty, it’s difficult—impossible, really—to be accurate in the way journalists are accustomed to. Computational models typically learn from data about what happened in the past, but the past doesn’t always predict the future, and even if it did, there’s irreducible uncertainty about how the world will unfold. Predicting social systems is particularly fraught given the idiosyncratic behavior of individuals, who are subject to influence but also have agency in making their own choices. Accuracy becomes more about the accuracy of the uncertainty of an estimate rather than about the accuracy of a specific fact.11 And even if uncertainty is faithfully represented and communicated, we’re left with the question of how people will act on that uncertain information, of how attitudes and downstream behavior of individuals or groups might be shaped.
Many election predictions in 2016 had Hillary Clinton as the clear favorite, reporting a 71 percent to 99 percent chance that she’d win. So just imagine you’re a Hillary supporter who is surrounded by media predictions and downstream coverage of those predictions, projecting a relatively high chance of a Clinton win. In some cases, that might dissuade you from voting if you think she already has a win locked in. One study found that “presenting forecasted win probabilities decreases the impression that an election is competitive compared to vote-share projections,” and that this could potentially depress voter turnout due to the overconfidence in the predicted outcome.12 That same study also found that there’s potential for people to misinterpret the probabilities from forecasts as vote shares: a 52 percent projected vote share could translate to a 71 percent chance of victory, since small slices of vote share in key swing states can be amplified in their impact on the outcome. The issue is that those two entirely different percentages can often be confused by people who don’t consume statistics 24/7. And as elections shift more to mail and early voting, it’s unclear how published predictions could be altering the vote weeks or even months before Election Day.13 When some elections are won with margins of a few thousand votes, even small shifts in voting behavior could be consequential to outcomes. It’s unclear how such predictions could affect other political behavior too, such as fundraising and volunteering. And it’s not just about the voters, but about political elites (like Jim Comey in 2016) who might be moved to action by an air of confidence engendered by the prediction-driven horse race coverage.14
The specifics might be new, but the use of predictions in elections, and the underlying concerns about how predictions might shape political behavior more broadly, are not. Within a year of the univac computer’s invention, in 1951, it was already being loaded up with data to try to predict the outcome of the 1952 election, making an appearance on CBS News on election night with an accurate forecast based on early vote returns. By 1960 the Kennedy campaign may have incorporated a report from the Simulmatics Corporation that modeled polls in a computer to simulate messaging strategies for different demographic groups.15 But even before the application and growth of digital computers, a 1949 forum hosted in the shadow of the Truman-Dewey election (polls had Dewey ahead, but Truman won handily) already raised the issue that the polls might have influenced the election’s outcome.16 The famous pollster George Gallup, who participated in the forum, didn’t get the concern, stating that “Although I fail to see that election forecasts work any good, I certainly see no harm in them.” While there was some dissent, the argument that polls can be used as a counterweight to the wild assertions of politicians was already firmly established. Poll-based predictions were largely seen as a part of the media system that wasn’t going to go away.
And it turns out that polls did, in fact, not go away. They’re still covered extensively by the media during elections.17 Instead, predictive journalism techniques help make them better by aggregating and simulating how state polls might add up to different election outcomes. The predictions can help smooth out those outlier polls that sometimes soak up attention, and they supply an important translation of data on vote shares from polls to political outcomes, given structures like the Electoral College in the US or the multiparty system in Germany. In short, polls or predictions based on them cannot be put back in the bottle. Such information about the future can help further inform fundamental mental processes of prospection that aid human learning and adaptation.18 And while journalists need not fulfill such human needs simply because they exist, a strong demand creates a gap in the marketplace of information that might otherwise be filled by pundits. To better fill this gap, journalists need to establish and codify what it means to predict responsibly.
This report is one small step in helping lay the foundation for a responsible journalistic practice of prediction. In the next section I’ll provide some more detail on what exactly we mean by “predictive journalism.” Then I’ll go into depth on election case studies based on interviews with some of the genre’s key players working at FiveThirtyEight, The Economist, and the Washington Post. After that I’ll step back and look at the broader context of predictive journalism, to examine how predictive journalism adds value and can be implemented in responsible ways by reflecting uncertainty and transparency. Finally, I synthesize all of these observations toward what I think could constitute ethical practice, offering some ideas and recommendations for future work on the topic.
What Is Predictive Journalism?
When we make predictions, we “declare or indicate in advance.”19 While formal definitions of prediction emphasize its orientation toward the future,20 here we adopt a simplified and pragmatic definition of prediction as “filling in missing information.”21 In other words, predictions can be made about the past, present, or future, but are made without us knowing the truth of the matter. This also means that they may or may not be fact-checkable depending on what we know, could know, or will eventually know about the world. Predictions about specific future events are typically referred to as forecasts, whereas those about the present are nowcasts and those about the past are hindcasts.22 A prediction can be differentiated from a speculation based on the degree of rigor of the evidence backing it. A speculation is more like a guess with no firm grounding, whereas a prediction can be rationally substantiated and justified.
In framing predictive journalism explicitly as a form of computational journalism,23 this report considers it as the incorporation of predictive information such as forecasts, nowcasts, hindcasts, or other estimates into news production processes (e.g., reporting, publication, distribution) by using or relying on computational modeling techniques such as machine learning and simulation.24 To be sure, many computational techniques are now used extensively in news organizations for everything from anticipating who is going to subscribe to estimating which version of a headline will yield more clicks.25 But here my concern is more narrowly focused on how prediction plays a role in editorial processes of reporting and presentation of content, rather than in the optimization or distribution of content. In the course of reporting, journalists may produce and publish their own original predictions or incorporate predictions from other sources in their reporting.
Predicting Elections↩
Let’s look at a few examples in the domain of elections to make these abstract definitions more concrete, and illustrate some of the varied goals and possibilities for publishing predictions in the news media.
Perhaps the best-known journalistic election prediction comes from FiveThirtyEight, which has been at it since 2008. Managing editor Micah Cohen explained that the goal is to answer a basic question: “Who is leading this race and who’s likely to win?” As he elaborated, “It’s a question that people are very interested in and that the media covers extensively, and we think that the model is the best way to answer that question.” Of course, FiveThirtyEight isn’t alone in realizing there’s audience demand for election horse race coverage. Both the New York Times and the Huffington Post published election predictions in 2016 ahead of Election Day, though such initiatives were conspicuously absent in 2020. The Economist published US election predictions in 2018 and 2020, and has built models for recent German and French elections. These models draw heavily on polling information and sometimes incorporate economic information to run simulations that produce forecasts months in advance of Election Day.26
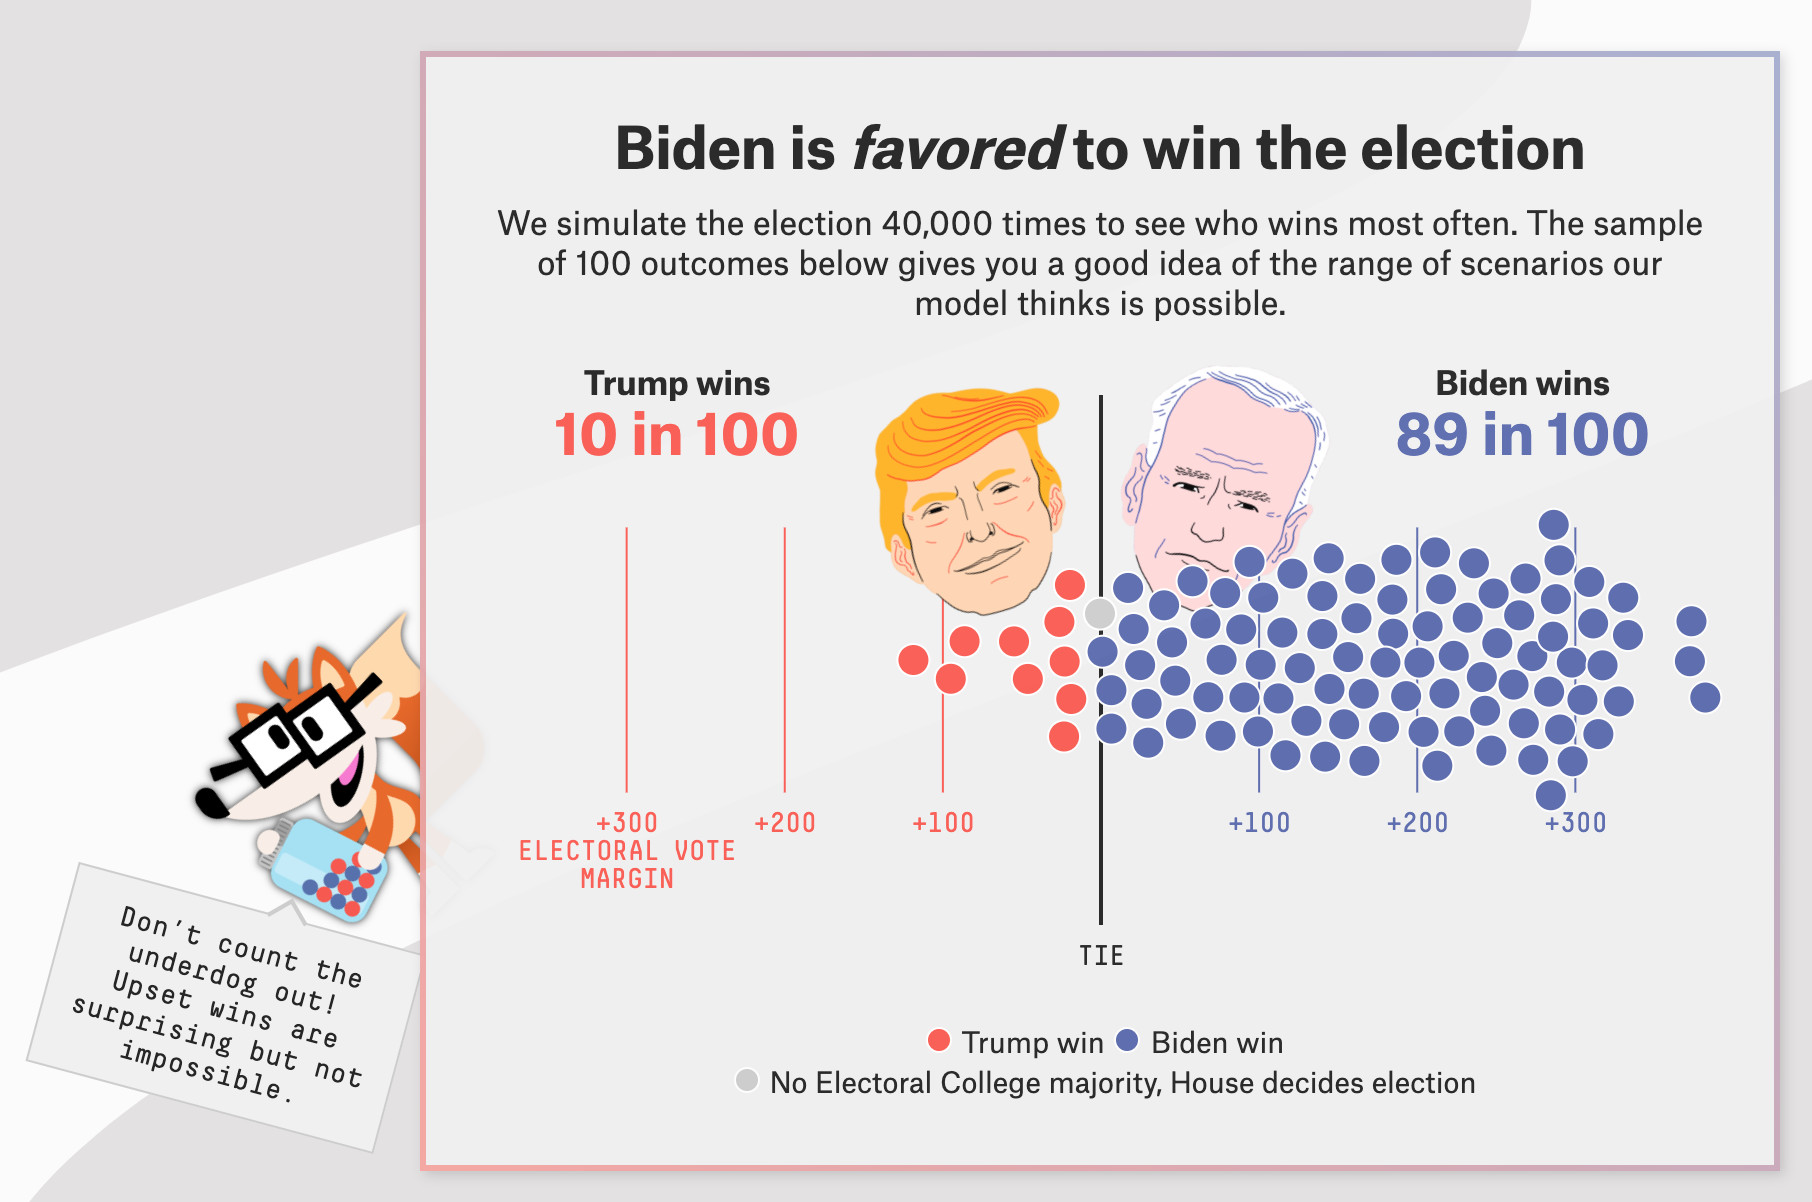
The 2016 US election was a wake-up call for many election forecasters, who had been overconfident of a Clinton win. The communication of uncertainty in election predictions has since come front and center. FiveThirtyEight substantially redesigned the presentation of its predictions in 2020, focusing on the question of “How do you present a forecast that communicates what we know, but also what we don’t know and what might change?”27 The design emphasizes a frequency-framed uncertainty display where each dot in the visualization reflects a random outcome from the model simulation. It’s harder to ignore the uncertainty in possible outcomes than if you were looking at a bar chart. A mascot, affectionately named Fivey Fox, reminds the viewer not to ignore that uncertainty.
Credit: FiveThirtyEight
The Economist display↩ has similarly made uncertainty communication a priority. This is reflected in the language used, such as “very likely,” and with a frequency-framing “better than 19 in 20,” as well as the initial visualization, which includes uncertainty intervals to show the range of possible outcomes reflected by the simulations. “We made the decision to forefront uncertainty in the model visually,” said Elliott Morris, a data journalist at The Economist who worked on the model. Yet it’s difficult to assess whether end users are really getting it: “It’s hard to know how much that comes through…that’s sort of where the trouble is for us.” Because the page leads with the chances of each candidate winning, it’s possible the display could “still lead to pronounced probabilistic thinking,” which he attributed to internal demands linked to the commercial pressure to attract attention. “People want the predictions internally,” he said, adding that “the predictions do best on our attention metrics.”28 Casual consumers may never scroll down past the top-line probabilities to consume key information that puts it in context.

Credit: The Economist
Visualization is a prominent component of FiveThirtyEight’s and The Economist’s predictions, often with light interactivity to facilitate navigation or toggling of information displays. But more involved interaction is also possible with predictive journalism, such as the Washington Post’s Opinion Simulator, which asks the user to engage in choosing parameters for a predictive model of the 2020 US Democratic primaries.29 The interface invites users to make their own predictions by choosing how they think their candidate will do in the polls and in fundraising in the run-up to the primary. Based on those selections, the model simulates possible outcomes and shows users how that could affect the candidate’s performance against the rest of the field.
The project’s main author, David Byler, explained the goal not as prediction so much as helping users think about what factors matter in the primary. “All of these models are a theory about elections and their ideas about how we should think about polls and about how races are related to each other,” he said. “My goal with the simulator was sort of to crack open the mode of thinking, so that people could see it better.” This use case for predictive models was also endorsed by Elliott Morris: “The story is not the prediction; it’s about the process that we uncover with the modeling.” Predictive journalism relies on a formalization—a model—of the world, which, beyond providing that top-line, attention-grabbing prediction, can also aid in deeper explanatory journalism of how politics works.
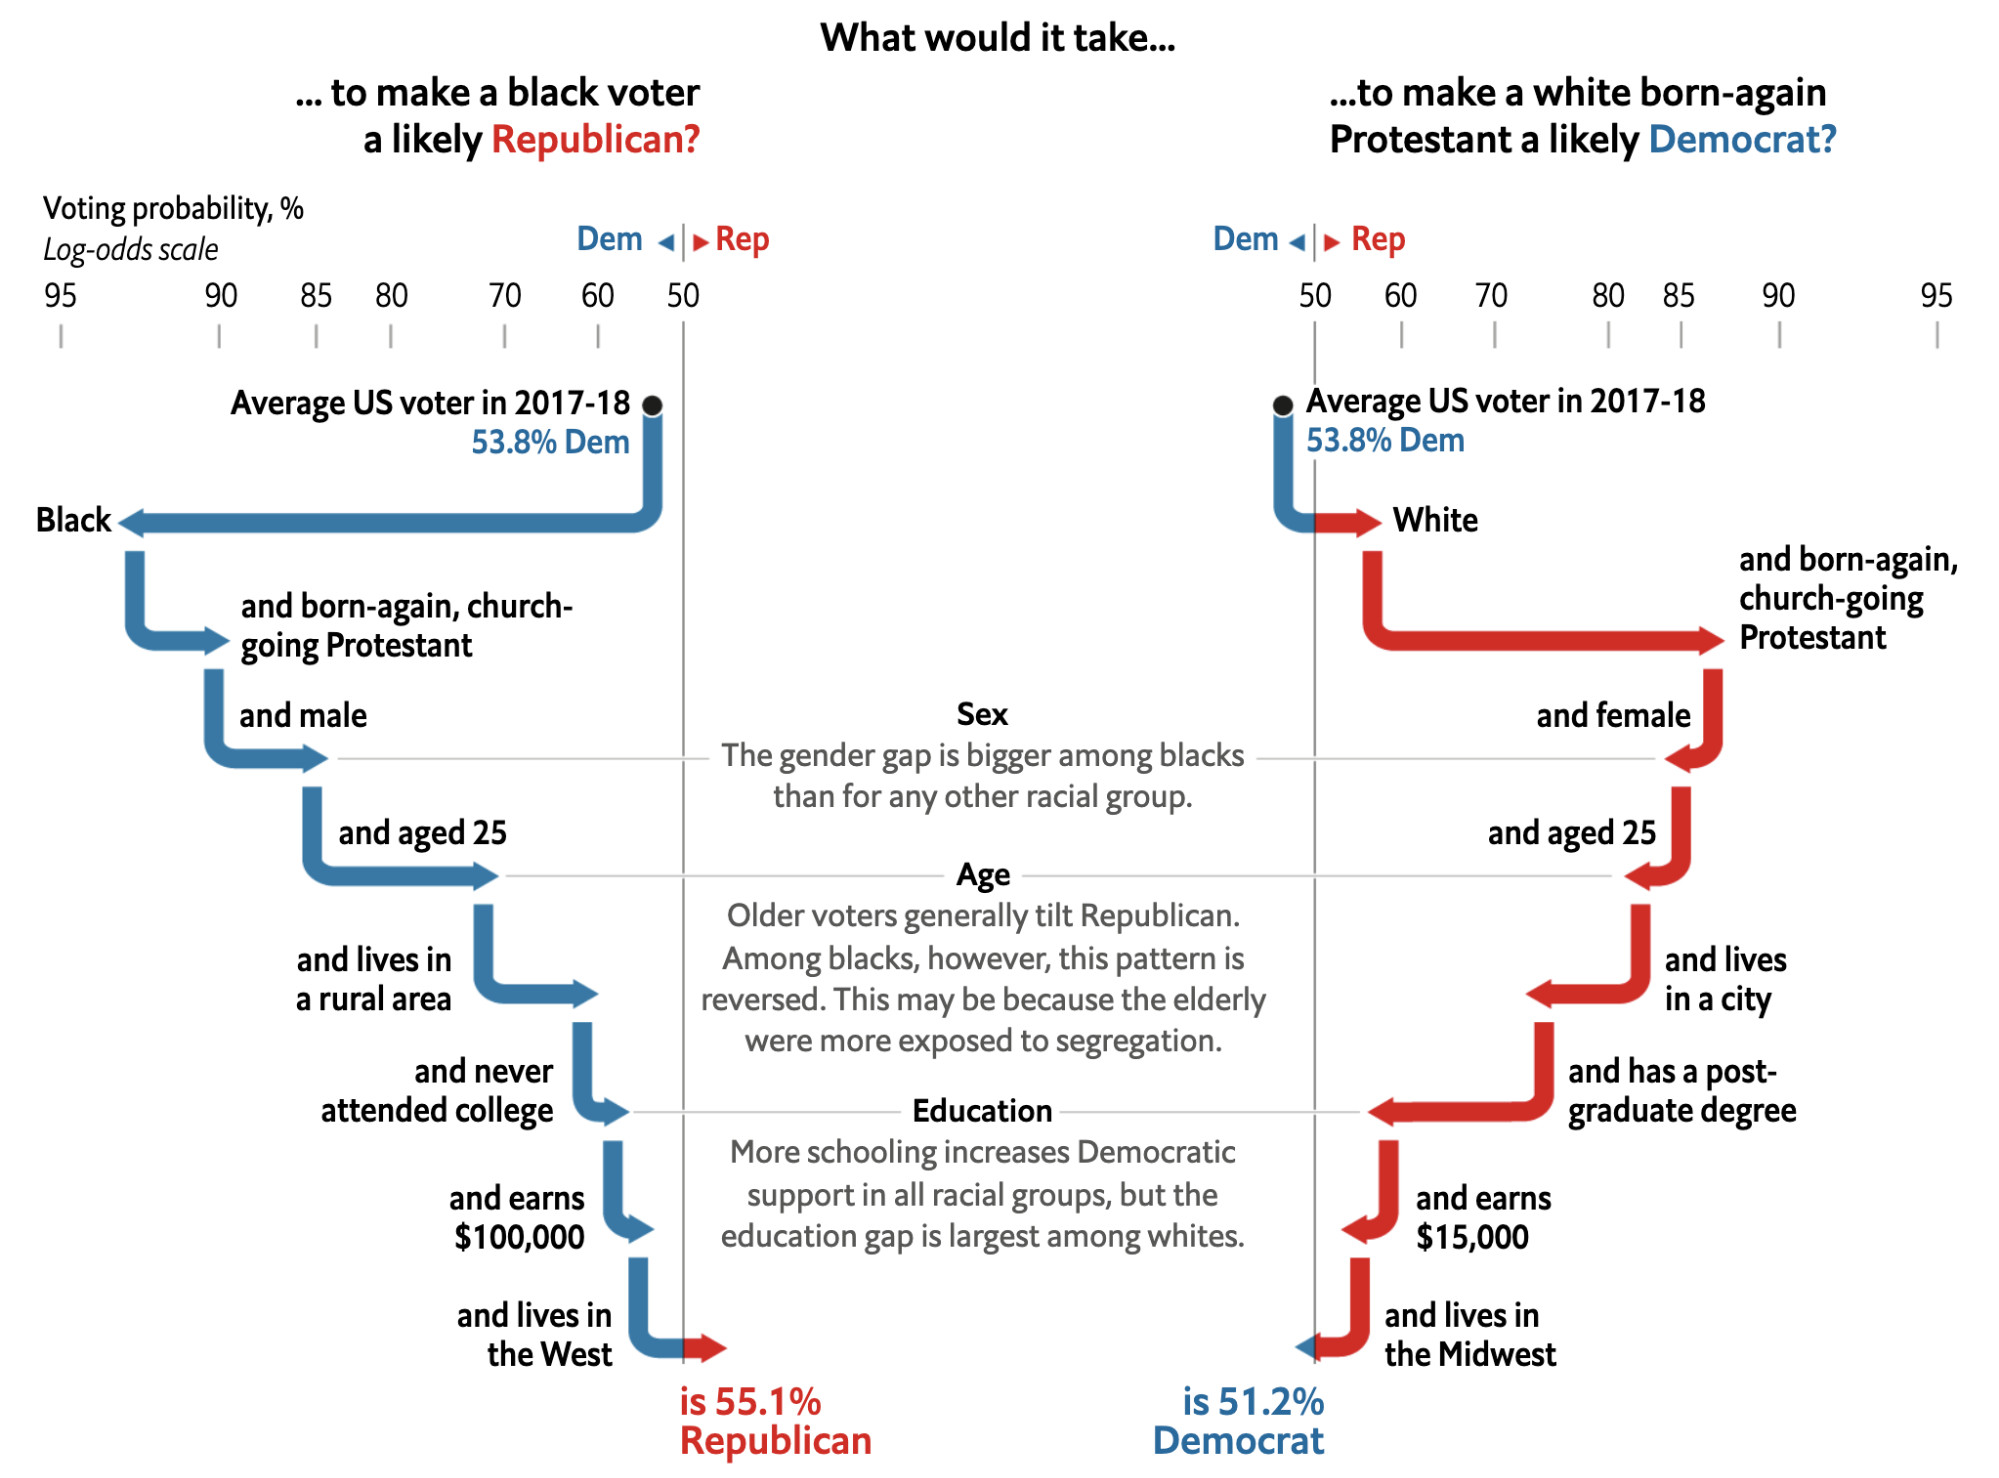
The type of interaction in the Prediction Simulator enables counterfactual thinking through concrete what-if scenarios that the user creates: what might have happened if, for instance, a candidate did better in the polls but worse in fundraising. Counterfactual thinking can also be used to illustrate unlikely scenarios that might surprise readers, like when The Economist considered what it would take “to make a black voter a likely Republican” or “to make a white born-again Protestant a likely Democrat.”30 The Economist model predicts voting intention for each party based on a number of demographics. It then uses that model to illustrate these salient counterfactuals. More broadly, it demonstrates how predictive models can be used to describe and explain the characteristics of voters associated with particular voting patterns.
Credit: The Economist
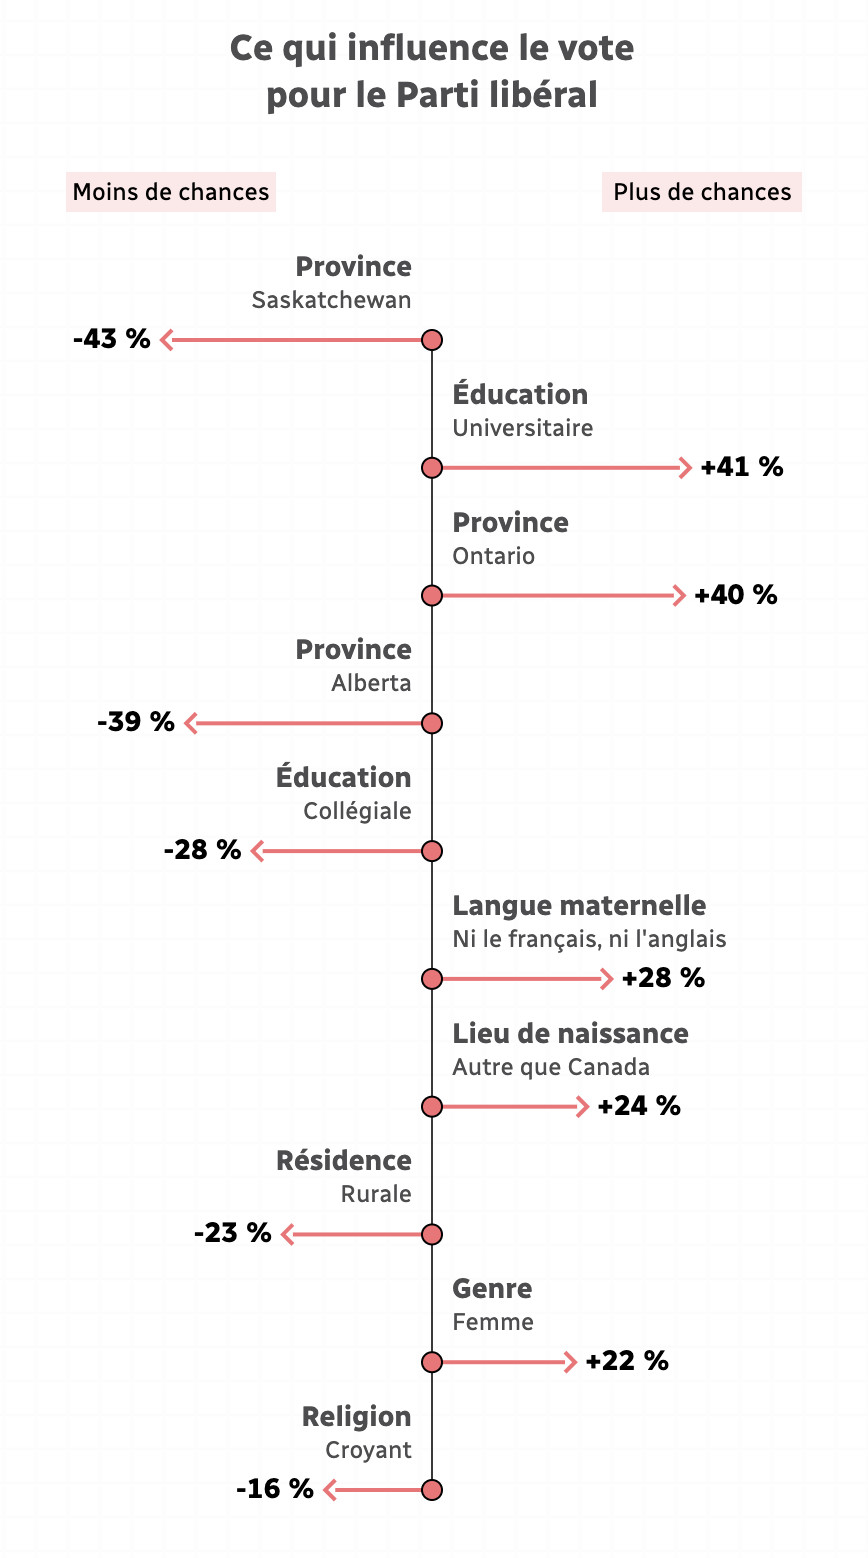
Radio Canada published a similar interactive article for the 2019 elections that predicted the party that would most appeal to a voter type whose age, sex, education, religion, and other demographic characteristics were selected by the user.31 The article walks the reader through how much the factors increase or decrease the chances that a voter would vote for each of the six parties. This type of insight from a predictive model is again not really about the prediction per se, but rather about how it helps explain the appeal of different political parties to various demographics. Computational social scientists would refer to this as explanatory modeling,32 where the goal isn’t predictive performance but rather showcasing the relative weights of different variables in the model: How much does education matter in comparison with location, or religion?
Credit: Radio Canada
The Radio Canada project illustrates a case where the model wasn’t originally developed by journalists, but rather by an external team of political scientists and statisticians. This is a somewhat common approach for predictive journalism, given how much time and effort can go into developing an original predictive model. Political scientists are involved in a range of election-modeling initiatives, offering opportunities to report on those models as sources of information.33 Related research on covid modeling has shown that models as sources often act as a kind of substrate for additional interpretation by journalists, modelers, or other experts who need to put predictions from the model into context.34 At times journalists find themselves redoing all the work to vet a predictive model before they visualize and report it. But other times the models are less well vetted, treated more as attributable sources. Micah Cohen from FiveThirtyEight explained the distinction: “We have published other people’s forecasts and…if it’s a project where the project rests in large part on one or two models, we will vet the methodology.… If it’s more of an aggregating project where it’s not one or two things, you’re looking at fifteen different forecasts of something, we’ll vet the sources, like, ‘Is this a voice that’s worth sharing with our reader?’ But in those cases we won’t peer-review every model.”
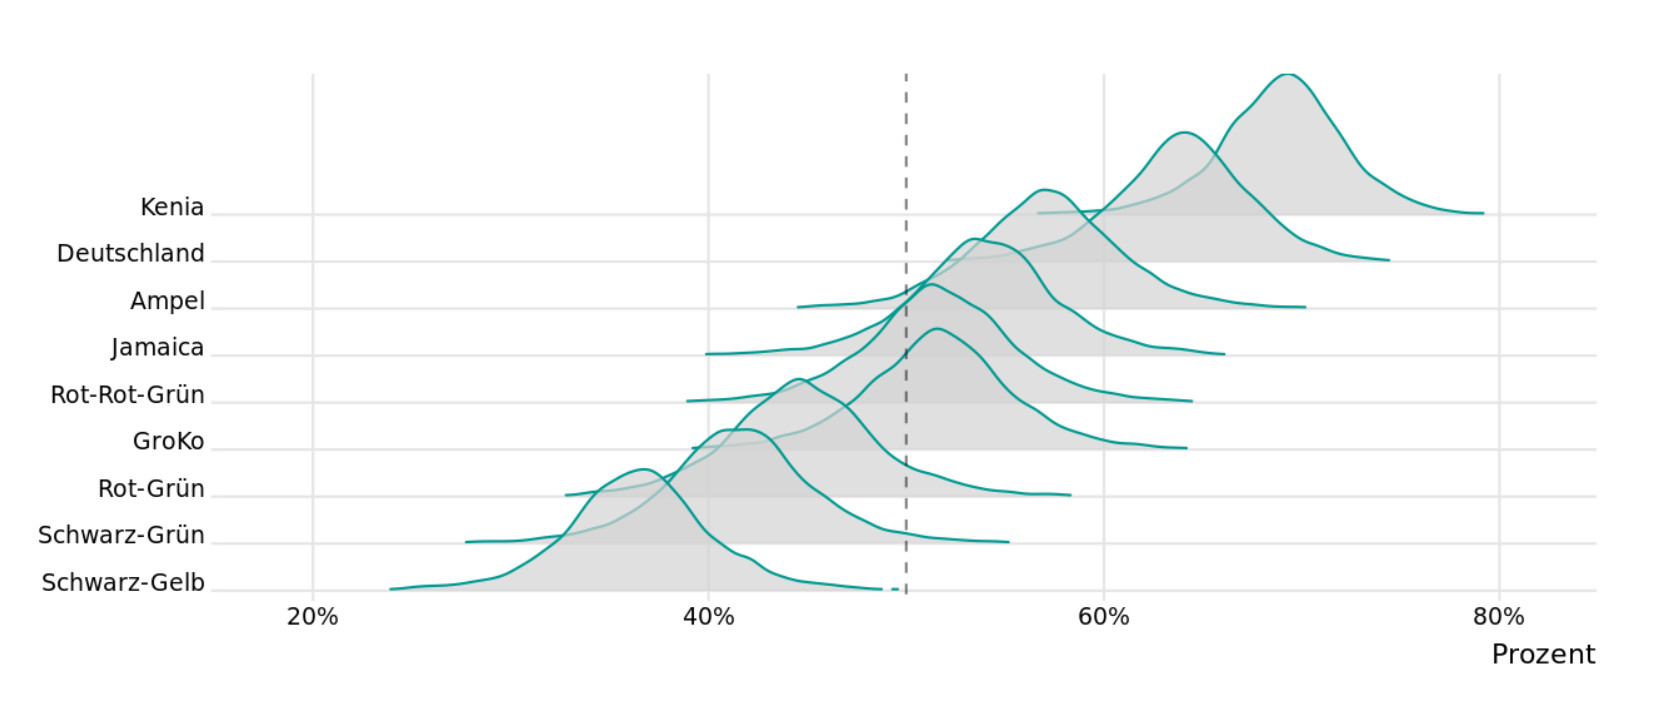
Scenarios are a common way for communicating different predictions. For instance, predictions for the 2021 German elections published by The Economist35 and Süddeutsche Zeitung36 (SZ) projected the likelihood of various political coalitions that could form as the result of the predicted performance of the constituent parties. The SZ display further emphasized the direct comparison of these scenarios by showing the distribution of probabilities for each. Scenarios can also be laid out non-interactively to help users think through a set of pre-set possibilities that are interesting to consider. For instance, FiveThirtyEight presents a number of politically interesting scenarios as part of its US election prediction page, including the chances of candidates winning in a landslide, winning the popular vote but not the Electoral College, or having the election hinge on a recount.
Credit: Süddeutsche Zeitung
There’s a lot of attention on the top-line probabilities published in election predictions, but something that’s perhaps less obvious is that predictions are also valuable as an internal reporting tool. For instance, for the 2018 elections David Byler developed a model that drove a lot of his writing at the Weekly Standard.37 “It gives you the right frames for your story, it allows you to see trends holistically in ways that you might not otherwise, and it will spotlight races that you might not see if you were just doing something qualitatively,” he said. This approach was also reflected by Elliott Morris at The Economist: “We do use the models internally to make decisions on coverage…we use it to identify competitive states and to some extent counties.” One way they use their model internally is to rank locations that have a large difference between the projected outcome and the outcome of the last election. It’s used primarily to help orient where to send reporters. “We sent someone to Nevada based off of this last year, instead of sending them to Florida,” said Morris, later adding that “behind the scenes…predictive modeling happens way more than people know or people acknowledge or people would think, based off of our flagship data products or projects.” Predictive modeling is happening every week on that data team; you just don’t necessarily see it expressed as a fancy interactive webpage and visualization.
Another key use-case for election prediction is on election night, offering live predictions as voting results are reported in batches from individual precincts. Because rural and smaller counties in the US tend to report earlier in the evening after polls close, publishing those raw numbers can be misleading, since most of the actual votes will eventually be counted from larger urban areas. As the New York Times explains in its FAQ, “The core issue is that election results early in the evening are usually not representative of the final vote.”38 Statistical models can therefore be used on election night to attempt to account for this bias and present real-time predictions of results that provide context for reaching a more accurate interpretation than you would have if you just looked at the raw data.
The New York Times is perhaps best known for publishing a live election forecast on the evening of the 2016 US presidential election that disappointed millions of Clinton supporters with its (accurate) prediction of a Trump win. The forecast was presented as a needle on a semicircular gauge that updated in real time as polling results came in. The display signaled uncertainty by jittering within the prediction interval, upsetting some who expected a greater sense of determinacy.39 The Times has continued to refine its approach to live election prediction and published a revised version of its needle displays for the 2018 and 2020 elections. But due to shifts in vote-counting methods, such as toward more mail-in ballots in 2020, the Times was only able to predict the results of three swing states: Florida, Georgia, and North Carolina.40 Remarkably, although it took more than two weeks for the Associated Press to call Georgia in Biden’s favor, the Times’ prediction listed Biden as the “very likely” upset winner as of 6am the day after Election Day.
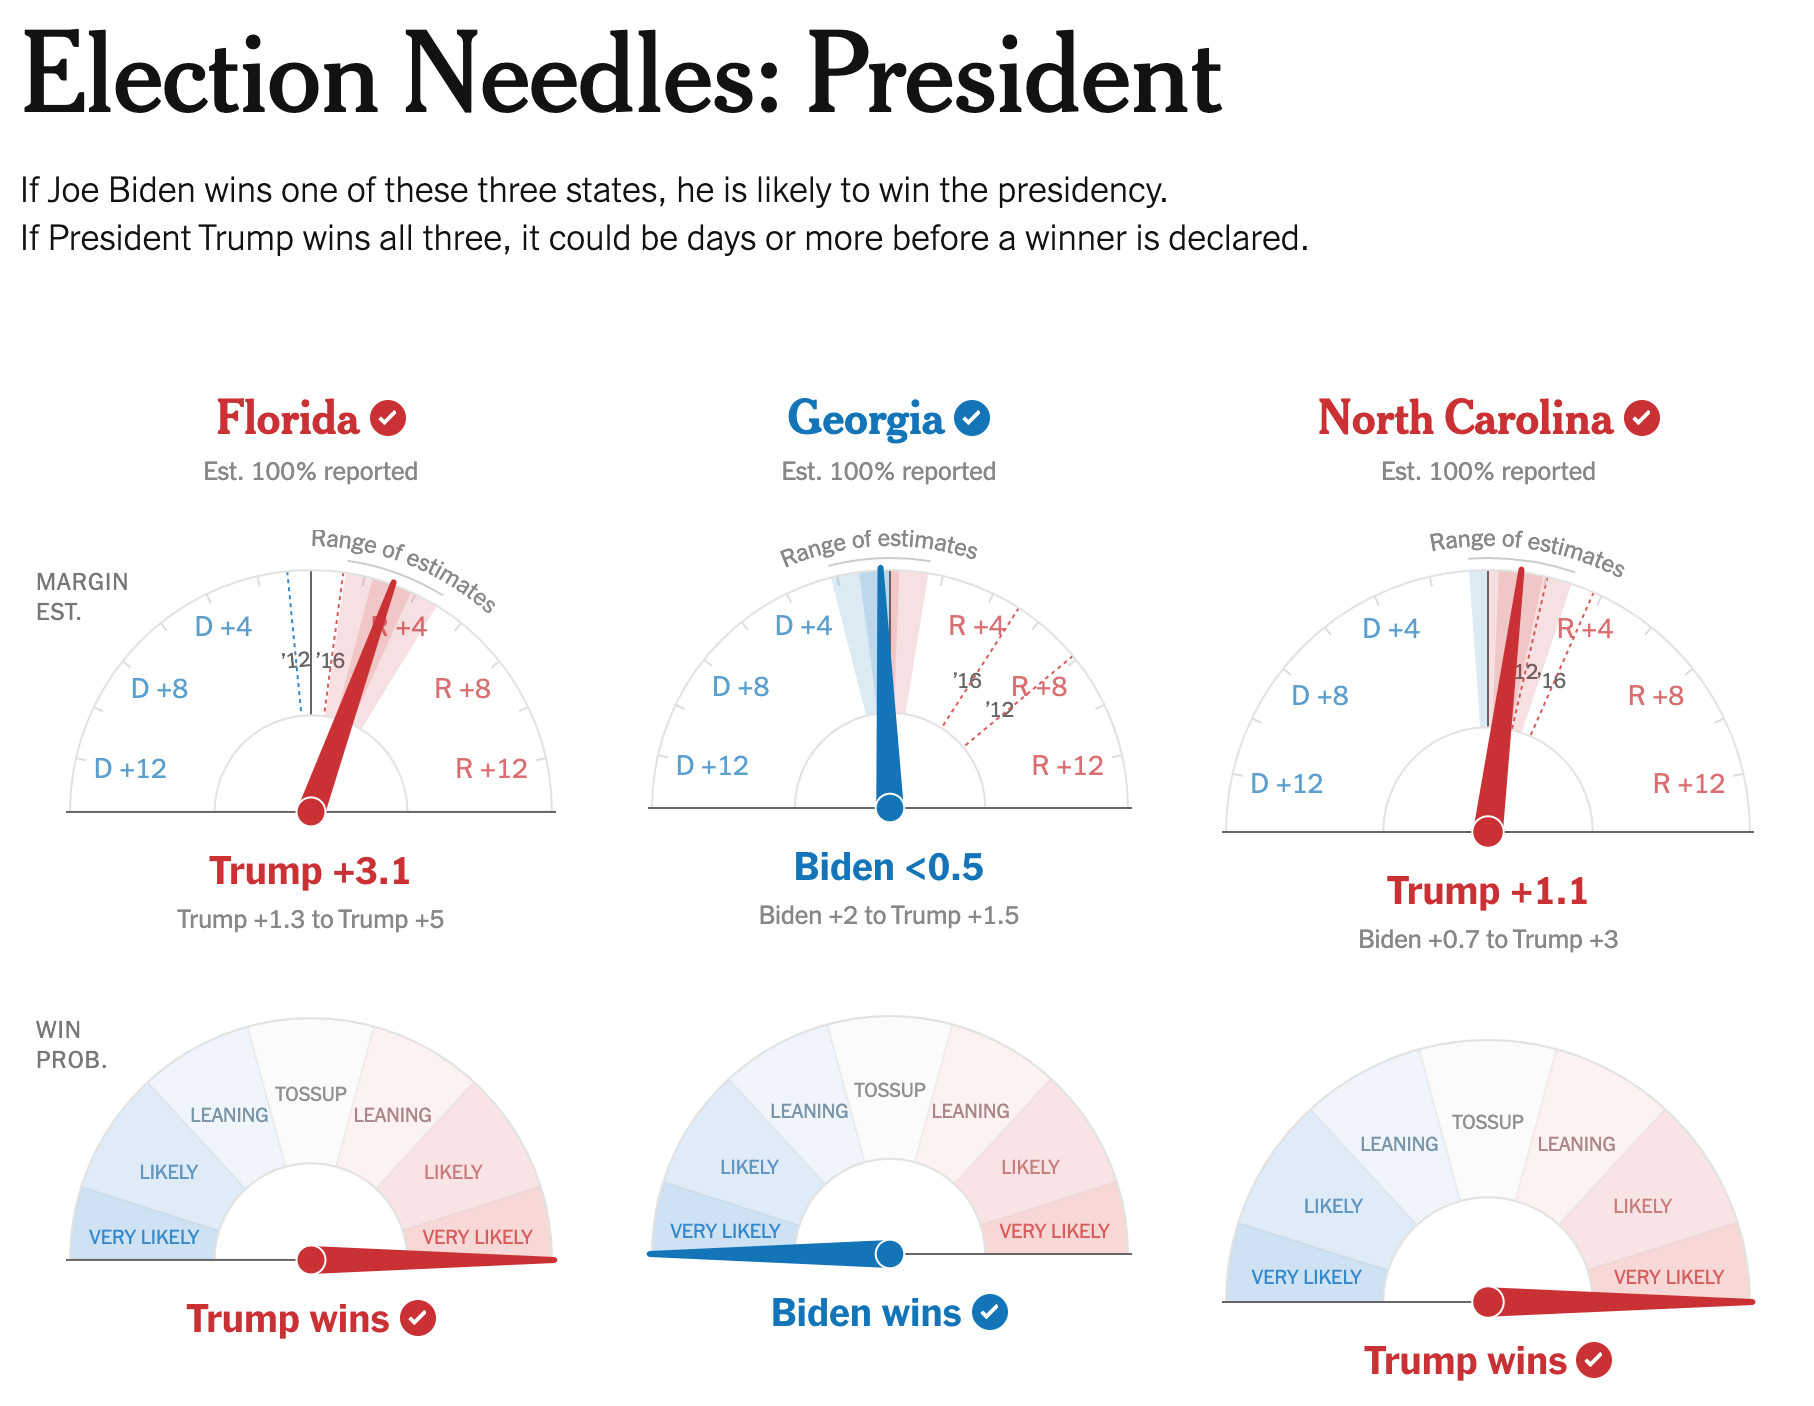
Credit: The New York Times
The Washington Post produced a similar live election model for the 2020 US presidential election, conveying information about the predicted proportion and lean of outstanding votes in particular states. The intent of the predictions was again to correct for biases in the order in which votes are tallied.41 Data scientist Lenny Bronner, who developed the model, alluded to another important aspect: “The night of election night when Donald Trump declared himself the winner, it was very clear from what we were showing on our pages that he was not right about that.… Without our work…it would have been easier to obfuscate the fact there were millions of votes left outstanding.” In other words, having an accurate prediction of where the race stood provided an additional piece of evidence to push back on Trump’s claims of victory.
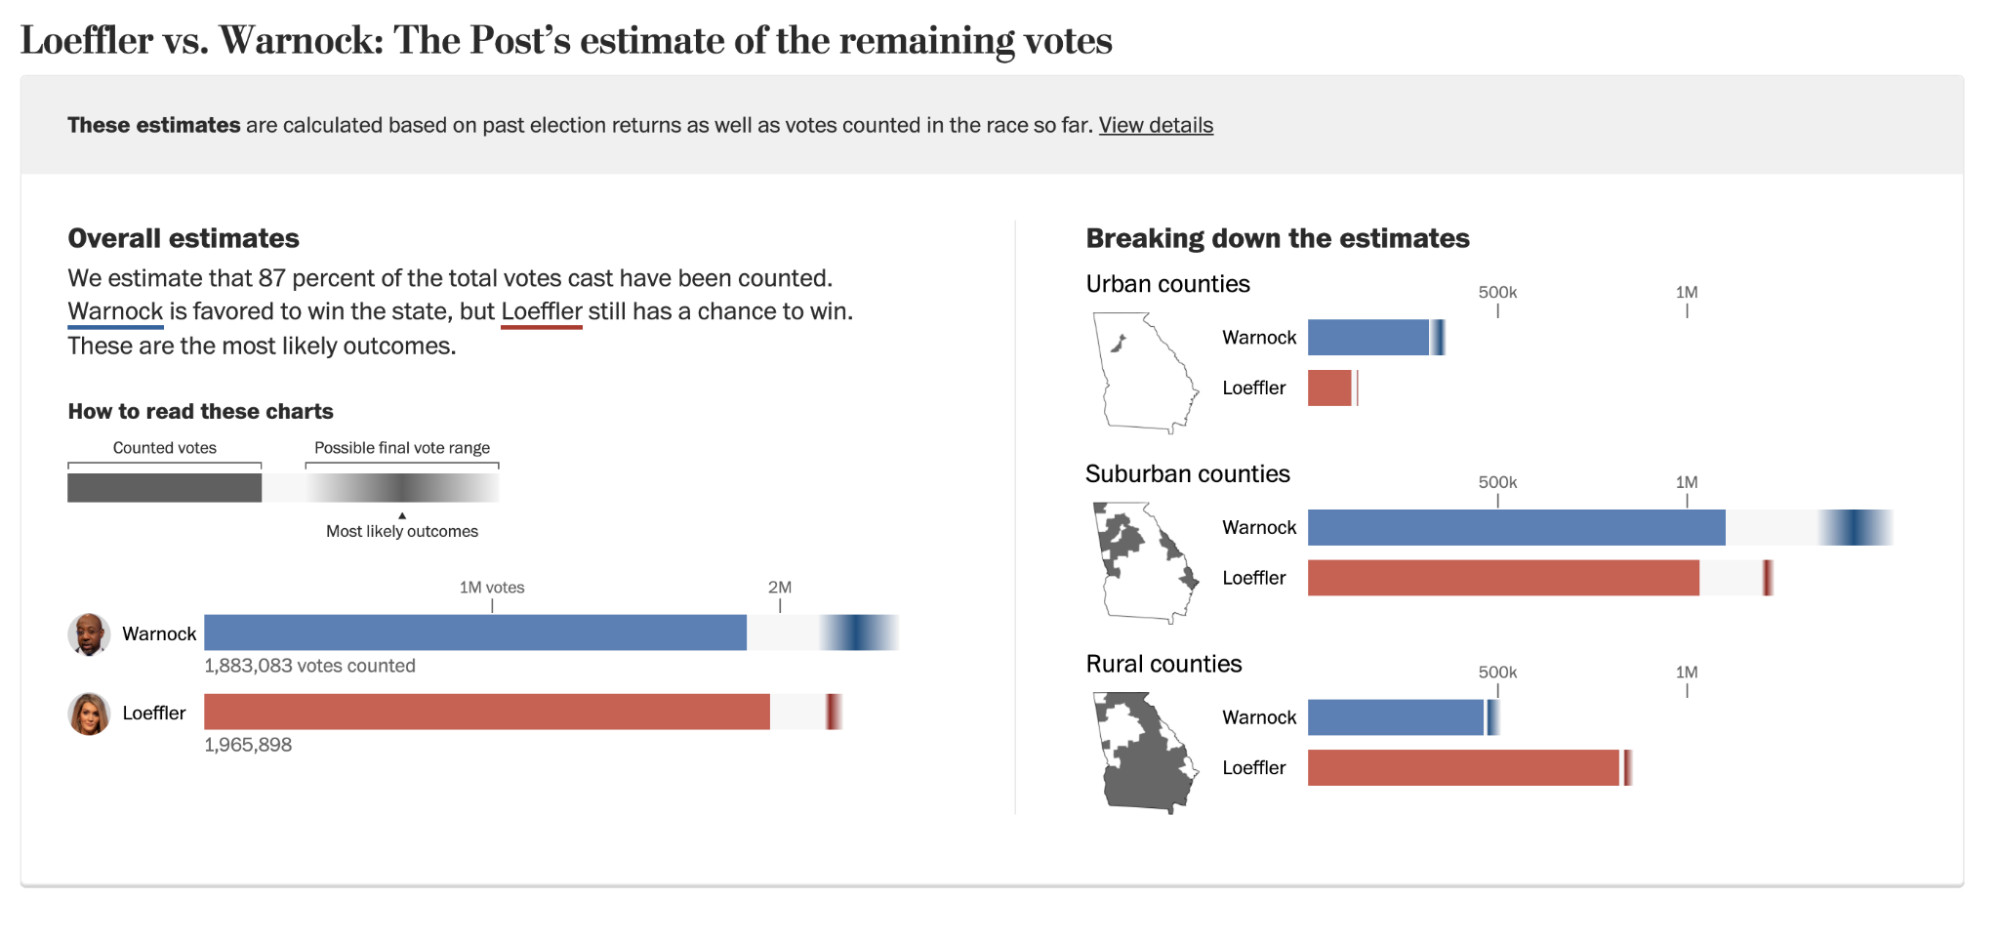
Credit: The Washington Post
FiveThirtyEight also published a live election model during the 2018 congressional elections, but did not do so in 2020. On election night of 2018, the FiveThirtyEight model very briefly started unexpectedly predicting—with up to a 3-in-5 chance—that there could be a Republican majority in the House.42 Traders in the UK noticed and US bond yields went up (briefly, for about an hour or two), presumably around fears that there could be higher inflation with a Republican Congress.43 Nate Silver, the editor of the model, had to step in and manually make it less sensitive to partial vote counts that had skewed unexpectedly Republican. That same night, the New York Times’ live prediction also failed early on due to a data pipeline issue and so wasn’t published until later in the evening.44
Doing predictive journalism live is really hard. As Silver himself explained in a podcast about the event: “Election night forecasts are inherently hard, because of the speed at which election nights unfold and the sometimes uneven quality of returns being reported in real time. The chance that a model will ‘break’ is fairly high—much higher than for pre-election forecasts.”45 With messy data and little time to diagnose errors during a high-stakes, high-pressure event, live prediction is not for the faint of heart.
Stepping Back: Predictive Journalism in the Broader Field
Predictive journalism isn’t only about elections. Coverage of the covid pandemic has been rife with predictions of how the virus would spread, when vaccination rates would reach herd immunity, and what public health officials and individuals might do to alter its course. Predictive journalism has also been published on other topics from sports to culture and business, not to mention the weather.
To better understand the breadth of predictive journalism, we curated a small data set of everything we could find. Admittedly, predictive journalism as we defined it is not prevalent in the news media, and we struggled to develop a generic methodology that would help us find examples. Running queries on content aggregators such as Media Cloud and Google News for keywords like “forecast” and “prediction”46 against coverage from a range of mainstream sources in the US yielded a few examples, as did a search through the 2020 Sigma Awards for data journalism.47 Due to the low yield of these approaches, we then pursued a purposive sampling approach48 by combing through the data journalism sections of sources that were known to produce predictive journalism, such as The Upshot from the New York Times, Graphic Detail from The Economist, and FiveThirtyEight’s Projects section. In the end our data set consisted of 81 examples from 17 sources, dominated by The Economist (24 percent), FiveThirtyEight (24 percent), the New York Times (21 percent), and the Washington Post (10 percent).49 This data set is not representative of all of the predictive journalism that may be in circulation, but is rather heavily skewed toward the sources we focused on in our purposive approach.
Unsurprisingly, the dominant topics in the data set were politics (40 percent), most of which was about elections, and health/science (39 percent), which was mostly related to the covid pandemic.50 The covid examples weren’t only about obvious topics like predicting case counts, but also about things like estimating excess mortality in the population, computing comorbidity risks, projecting vaccination rates, and simulating spread under various policy options. There were also some sports projects (11 percent) and a smattering of items related to other societal issues (6 percent) like real estate trends or natural hazards like floods. One business story focused on predicting Tesla factory output, and a couple of culture stories attempted to predict the outcome of the Oscars. It’s clear that predictive journalism is limited to societal domains that have abundant data, much as others have observed is the case for the broader field of data journalism.51
Based on the sample we collected, I undertook a qualitative content analysis involving thematic analysis of the examples to try to identify key patterns reflected in the content.52 Methodologically, this involved a process of iterative observation and note-taking, coding those notes into categories, identifying patterns and groups of codes that crystallized into themes, and writing memos to make sense of the material and define those themes more clearly. In the next subsections I detail some of these patterns related to apparent utility or value created, and elaborate on some of the practical elements related to interfaces, uncertainty, and transparency. My hope is that these descriptions are generative for other practitioners looking to see how predictive journalism could be used and how it can be implemented.
How Predictive Journalism Creates Journalistic Value
The examples I analyzed demonstrated a range of journalistic value, including communicating predictions or explanations, enabling analysis through counterfactuals and critiques, and informing downstream news coverage.
Communicative
A frequent goal of predictive journalism is the communication of some probability associated with a prediction. Many examples showed those probabilities directly in visualizations, often presenting them over time as they are updated. But as described above, explanations based on models are also a powerful way to communicate the importance or weighting of different factors. Often coupled with interactive visualizations, such approaches are not about predicting a top-line probability of an event, but rather about conveying the gist of how some complex system is structured and behaves. A particularly salient graphical illustration in this vein simulated coronavirus particles in an airplane to visualize their circulation through a hypothetical cabin, helping demonstrate, for instance, where particles flow after someone sneezes.53
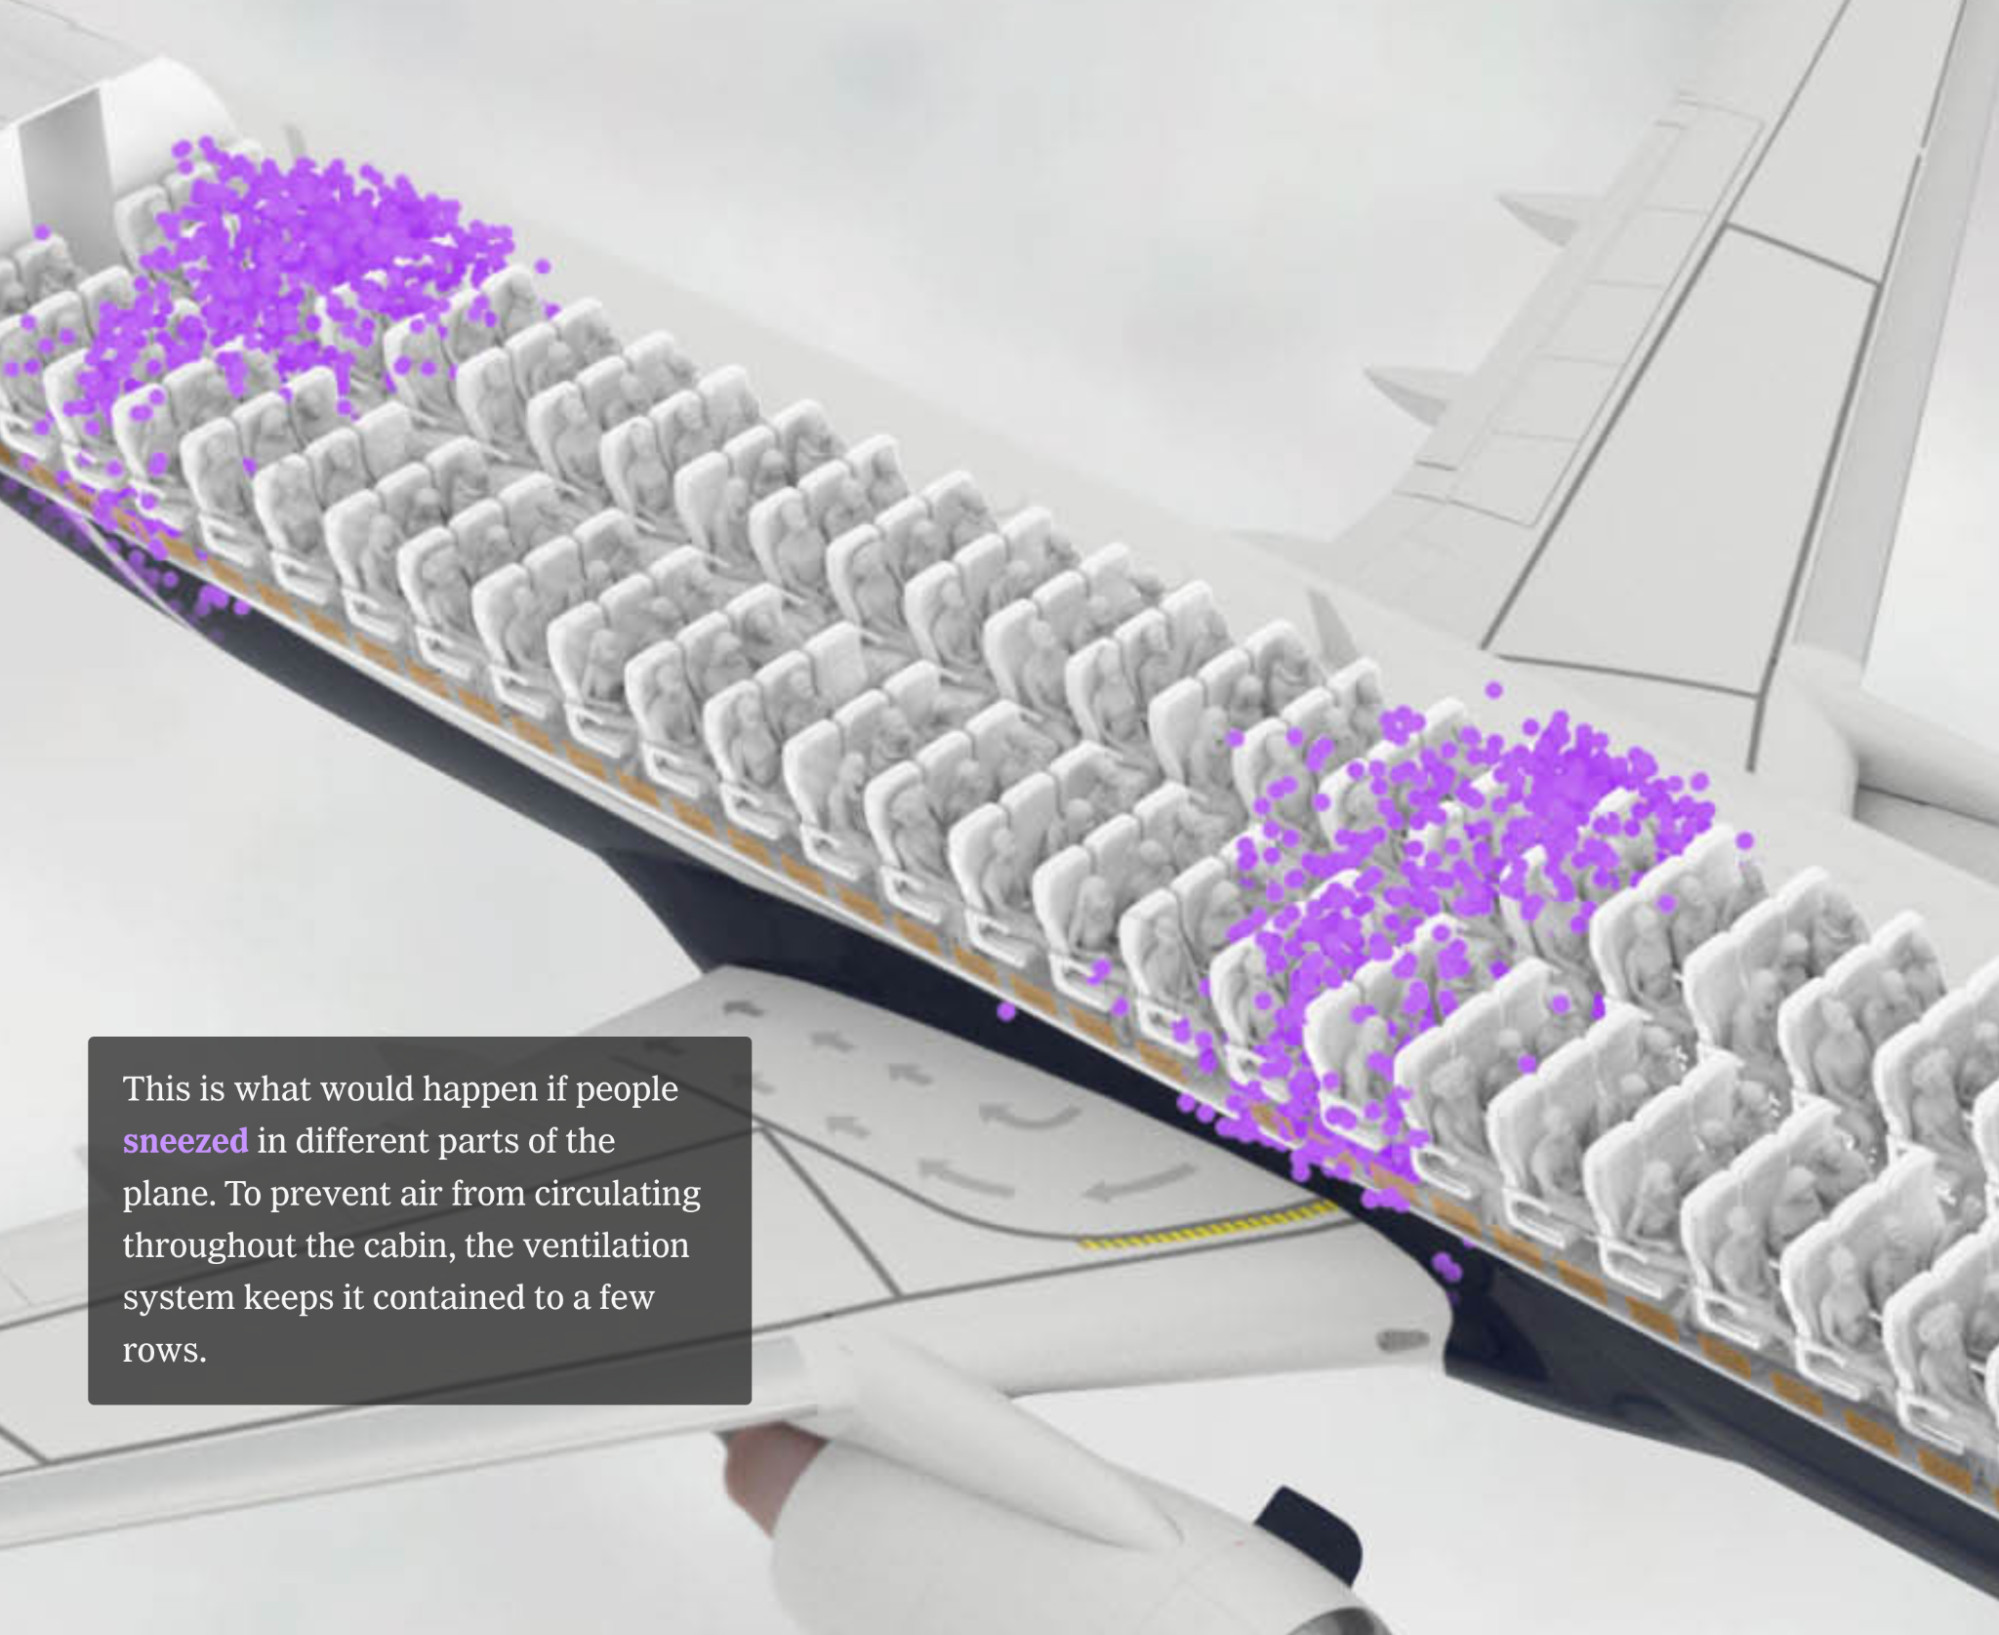
Credit: The New York Times
Another explainer that hinged on simulation was NPR’s presentation of “How Herd Immunity Works,” which visualized varying scenarios of a population consisting of healthy, vaccinated, and infected individuals.54 The simulations animate in the browser, showing how infections spread through the population when it’s 5 percent, 30 percent, or 75 percent vaccinated. Variations in levels of immunity from prior exposures are explored in subsequent scenarios.

Credit: National Public Radio (NPR)
Scenarios are a core aspect of how predictions are communicated. One way to think of scenarios is as a bundle of model parameters with a coherent meaning that can be conveyed to the audience. A scenario is a kind of representative description that the user can make sense of easily. For instance, it could reflect the level of a parameter that you can easily name, such as a “low,” “medium,” or “high” vaccination rate. Scenarios are often useful in comparisons and contrasts of different plausible realities, as shown in the last figure from the NPR piece. They can also be used to convey uncertainty in any one particular version, given that they present alternative realities, any of which is plausible.55
Analytic
Predictive journalism also functions as an analytic tool for helping readers compare items or consider the outcomes of what-if counterfactuals, facilitating comparisons between models or differently parameterized models, or between models and other descriptions of reality.56 Comparisons between items using predicted scores enable basic interface conventions like rankings, which can be an efficient way to present the information. For instance, FiveThirtyEight’s Soccer Predictions allows the user to compare teams based on a simulation of team performance grounded in the site’s Soccer Power Index (SPI) score.57
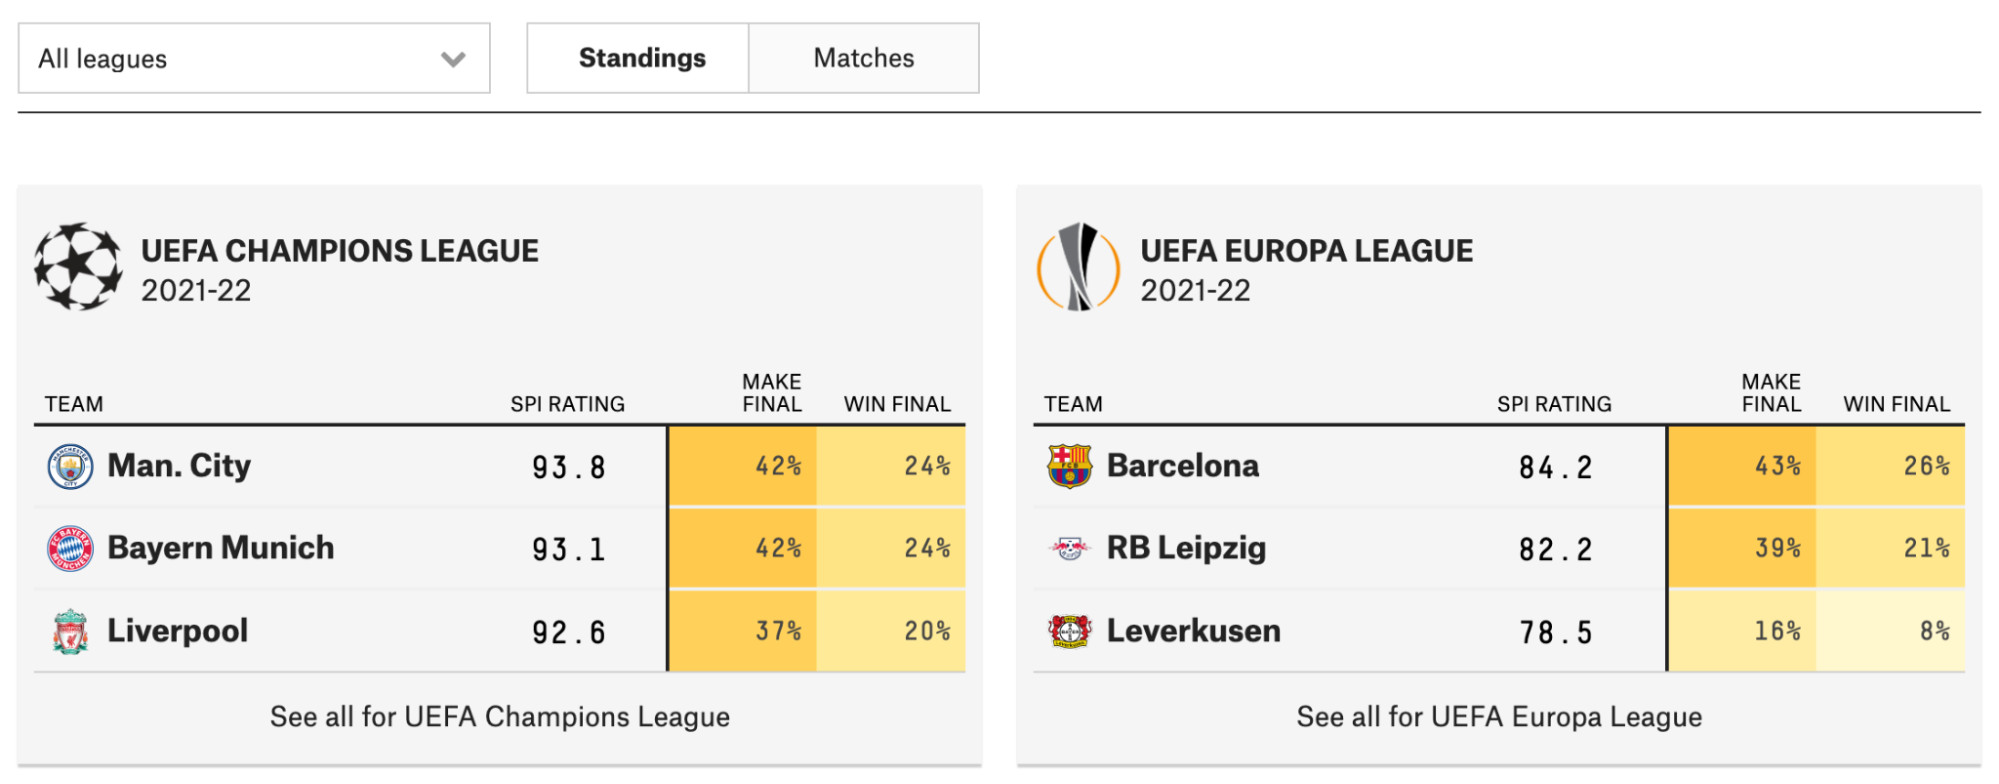
Credit: FiveThirtyEight
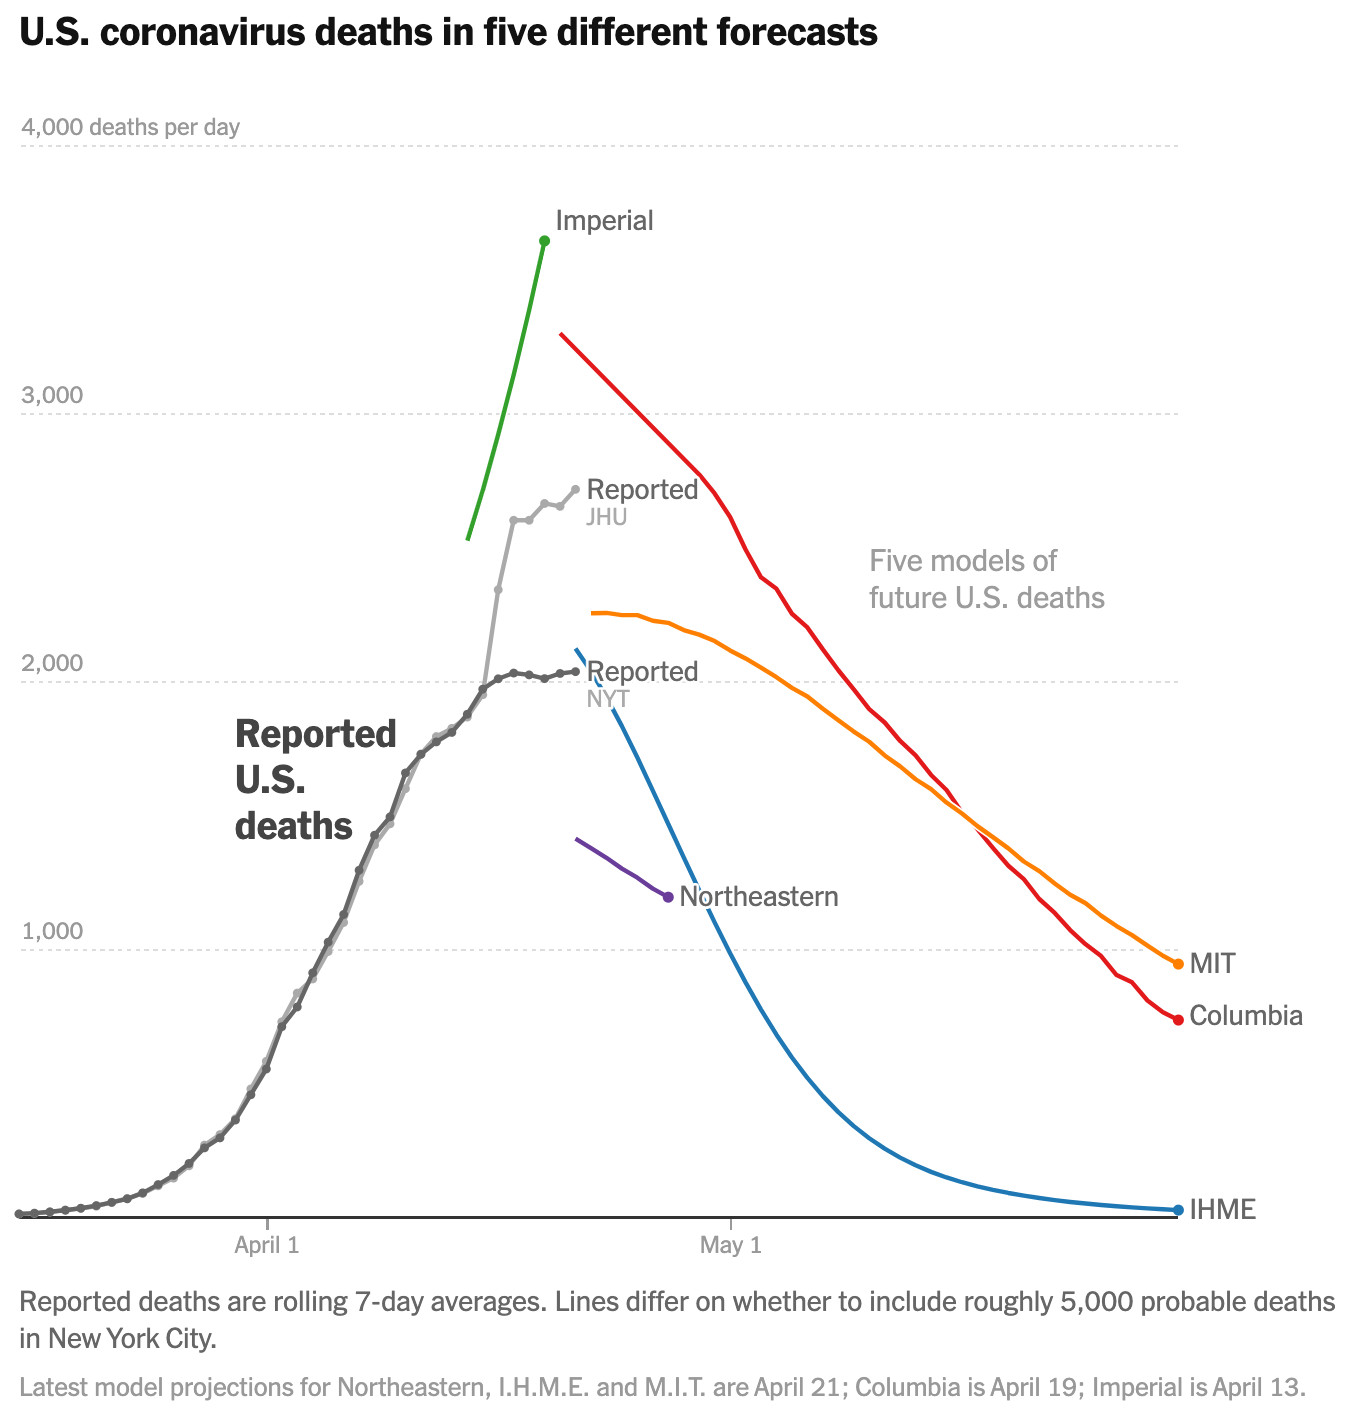
Predictions can also be compared against other data-driven baselines to establish a discrepancy that could be newsworthy. For example, The Economist used its excess-deaths model to predict how many people died in Wuhan during the early days of the pandemic, comparing that value with official statistics from China to suggest there had been a serious undercounting.58 A USA Today piece about flooding visualized the results of a model on a map, comparing the model’s predictions to those made by fema.59 Here we see the beginnings of what could indicate accountability, or at least critique, of predictions from official sources, which in the case of the flood risk maps haven’t been updated in quite a while. If an official source projects X, but the journalists’ preferred model projects Y, this gap can create an opportunity to ask questions of the official source. Other examples of predictive journalism in our corpus further expose the possibilities for critique. For instance, a New York Times article compared five leading forecasts for covid deaths, visually comparing their projections and also pointing out different types of assumptions and sources of uncertainty in each of the models that might help explain some of the differences observed.60
Credit: The New York Times
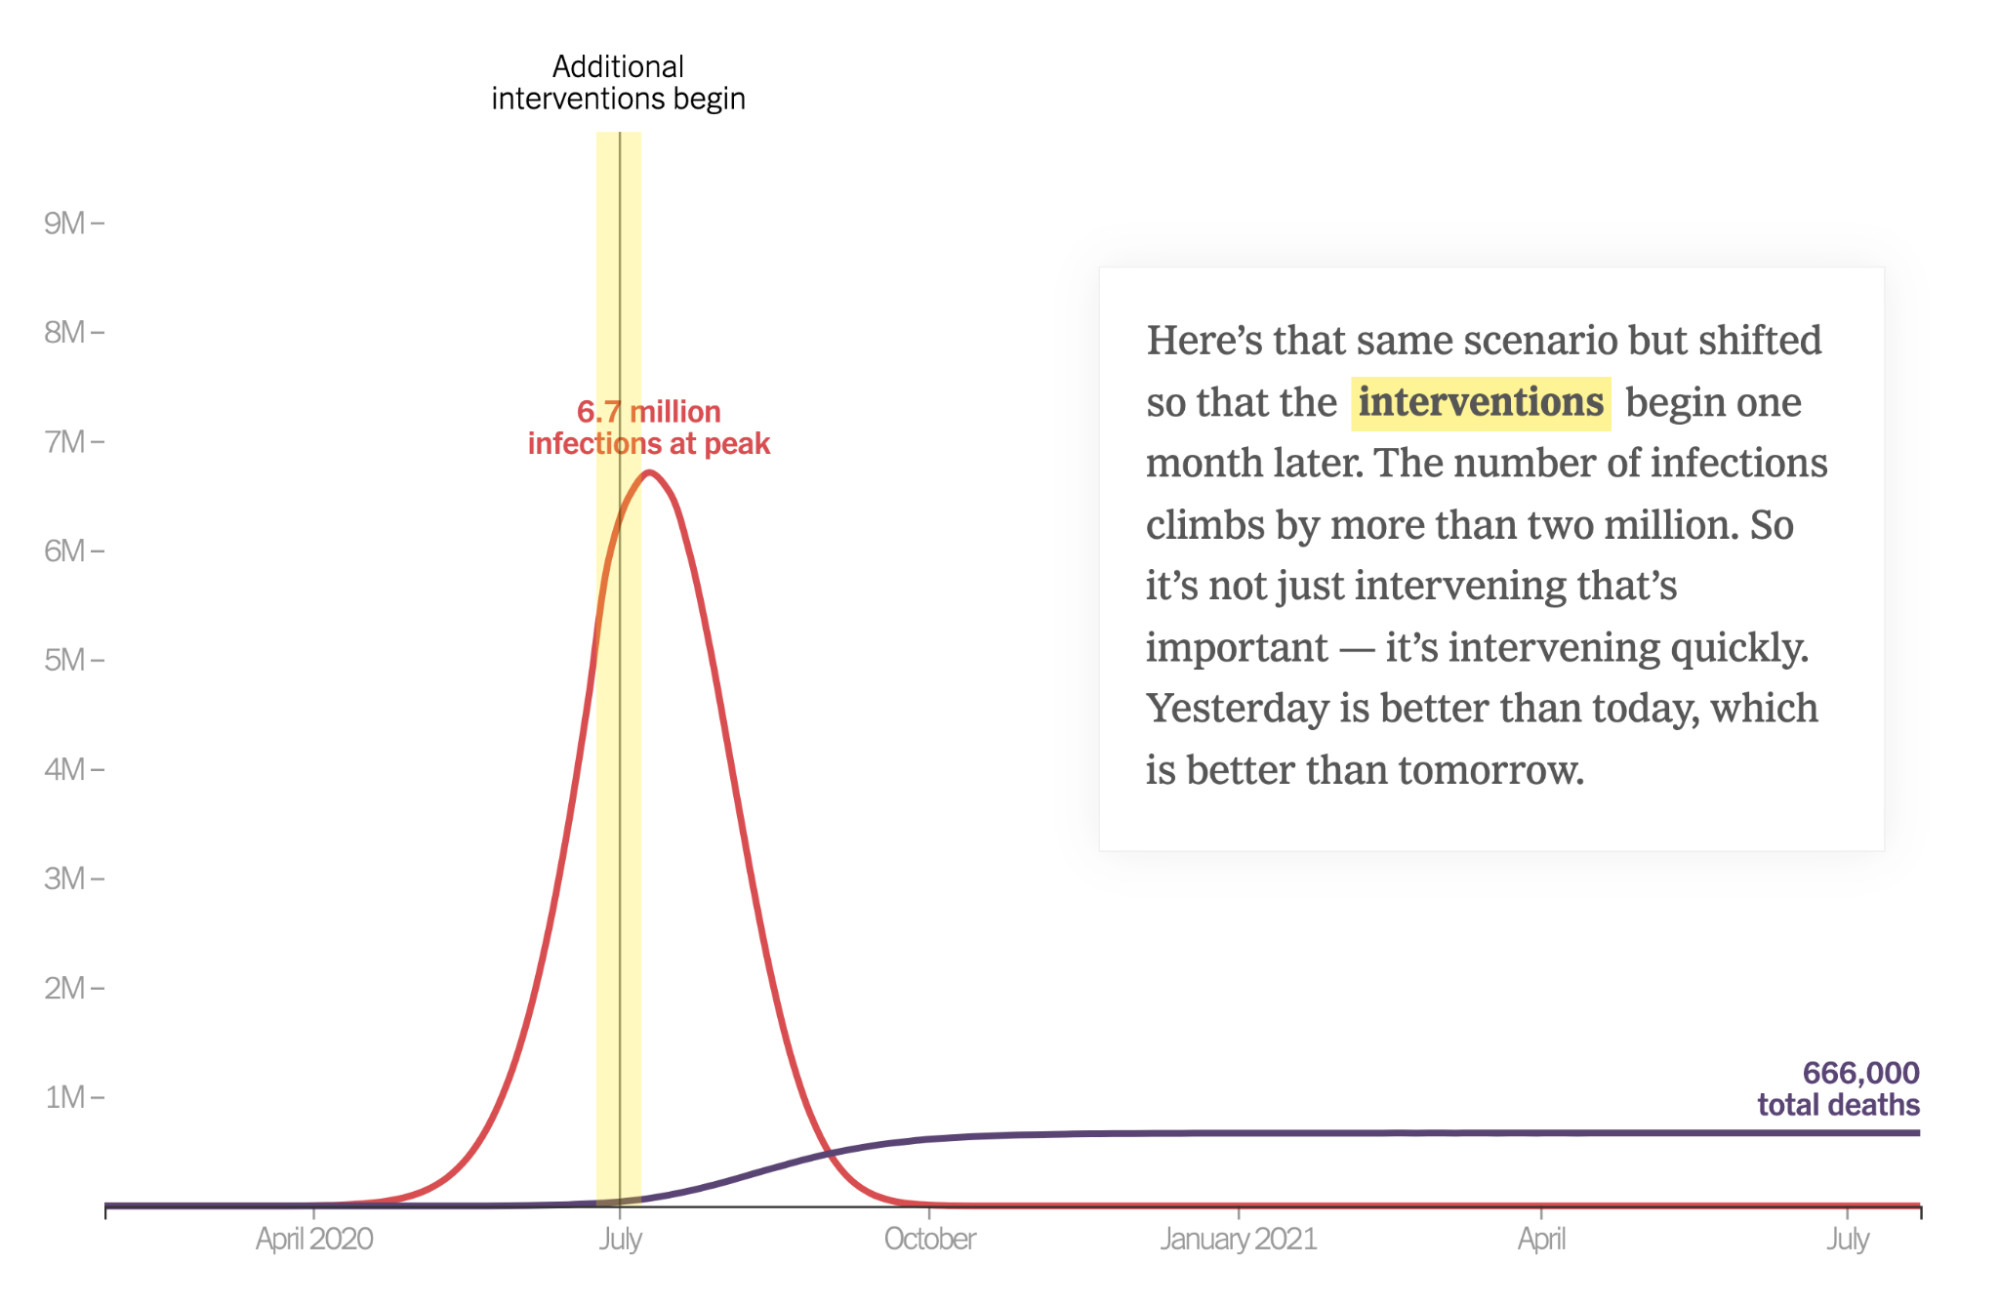
As discussed above, predictive journalism can also enable counterfactual what-if analysis. A salient example from early pandemic coverage is an opinion piece in the New York Times that visualized a predictive model of covid case and death counts, walking the user through various hypotheticals related to timing and degree of policy intervention to show how those might affect outcomes.61
Credit: The New York Times
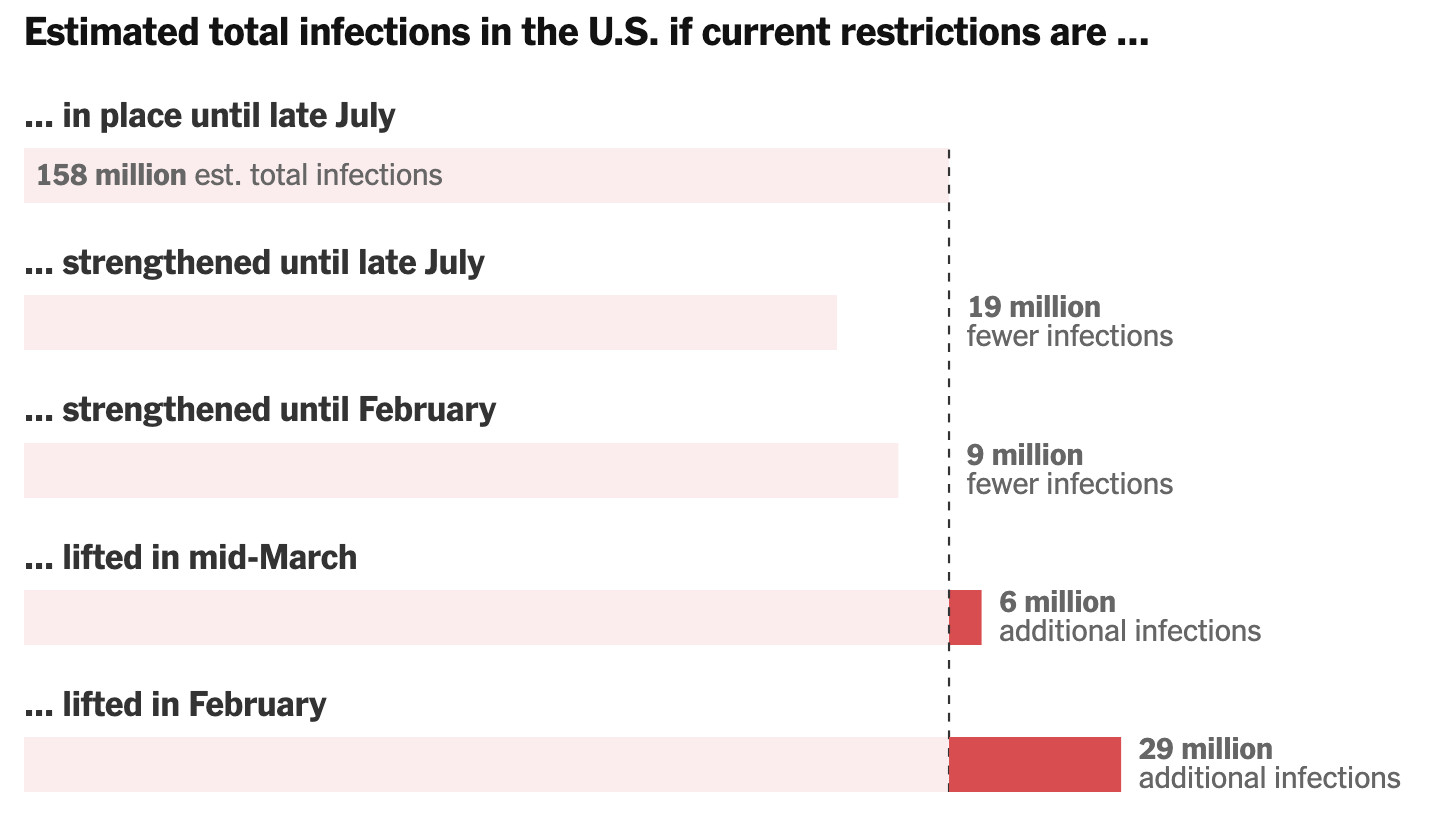
Later in the pandemic, as vaccines began to roll out, the New York Times used a model and a series of counterfactuals to reason through the impact of easing covid restrictions such as social distancing and masking before the vaccination campaign could fully ramp up.62
Credit: The New York Times
The article concludes that “vaccines alone are not enough…if precautions like working remotely, limiting travel and wearing masks are relaxed too soon, it could mean millions more infections and thousands more deaths.” We see in such cases the utility of models for building more well-grounded opinions, analytic arguments that consider alternative policy scenarios to argue for a preferred scenario.
Informing News Coverage
The impact of predictive journalism is not only about how it’s perceived by audiences, but also about how it is received and used, and how it can influence media production itself. There are a number of cases in our corpus where journalists were clearly deriving additional news items from the predictions. At Bloomberg, the Tesla Model 3 Tracker project even noted explicitly that the tool was used to publish more than 100 posts in the project’s integrated blog. Moreover, the predictions were “featured prominently in more than a dozen Bloomberg News stories.”63 At FiveThirtyEight, a prediction of President Biden’s approval rating was used to identify a “big swing” and led to a distinct article about that shift in which the author speculated on likely reasons for the dip, including Afghanistan, covid, and other economic concerns.64
Predictions published by one news outlet can also influence coverage in another. Much as with the previous examples of predictions informing analytic opinions at a single news outlet, they can also be used to drive other opinion makers in the larger media ecosystem. As Elliott Morris told me, “During the election season there’s probably hundreds of articles about the FiveThirtyEight forecast and our forecast and the RealClearPolitics polling aggregate every single day…in some ways it is the story of the year, what the models are saying, until the election is actually happening.” The amplification of predictions by derivative media raises the stakes for how an outlet frames and presents its predictions so that others—both end users and other news media—aren’t misled.
The Mechanics of Predictive Journalism
Here I turn toward aspects of how predictive journalism works in practice, including how it is presented to the user in interactive interfaces and conveys uncertainty and transparency information to aid in user interpretations.
Interfaces
Nearly all of the examples analyzed (98 percent) included some form of visualization, which is perhaps unsurprising given the centrality of visualization described in previous content analyses of data journalism.65 A broad spectrum of data visualizations was observed, from basic bar and line charts to maps and more sophisticated animated presentations or 3D illustrations. It’s clear that making predictions visible is a key aspect of communicating predictive journalism. Many of the examples in our corpus included presentations that were also interactive (71 percent). At a basic level, interactivity facilitates navigation within the information space of the prediction. This includes standard mechanisms for navigating data such as sorting, filtering, toggling views, panning, and searching, as well as ways to alter the time horizon of the prediction.
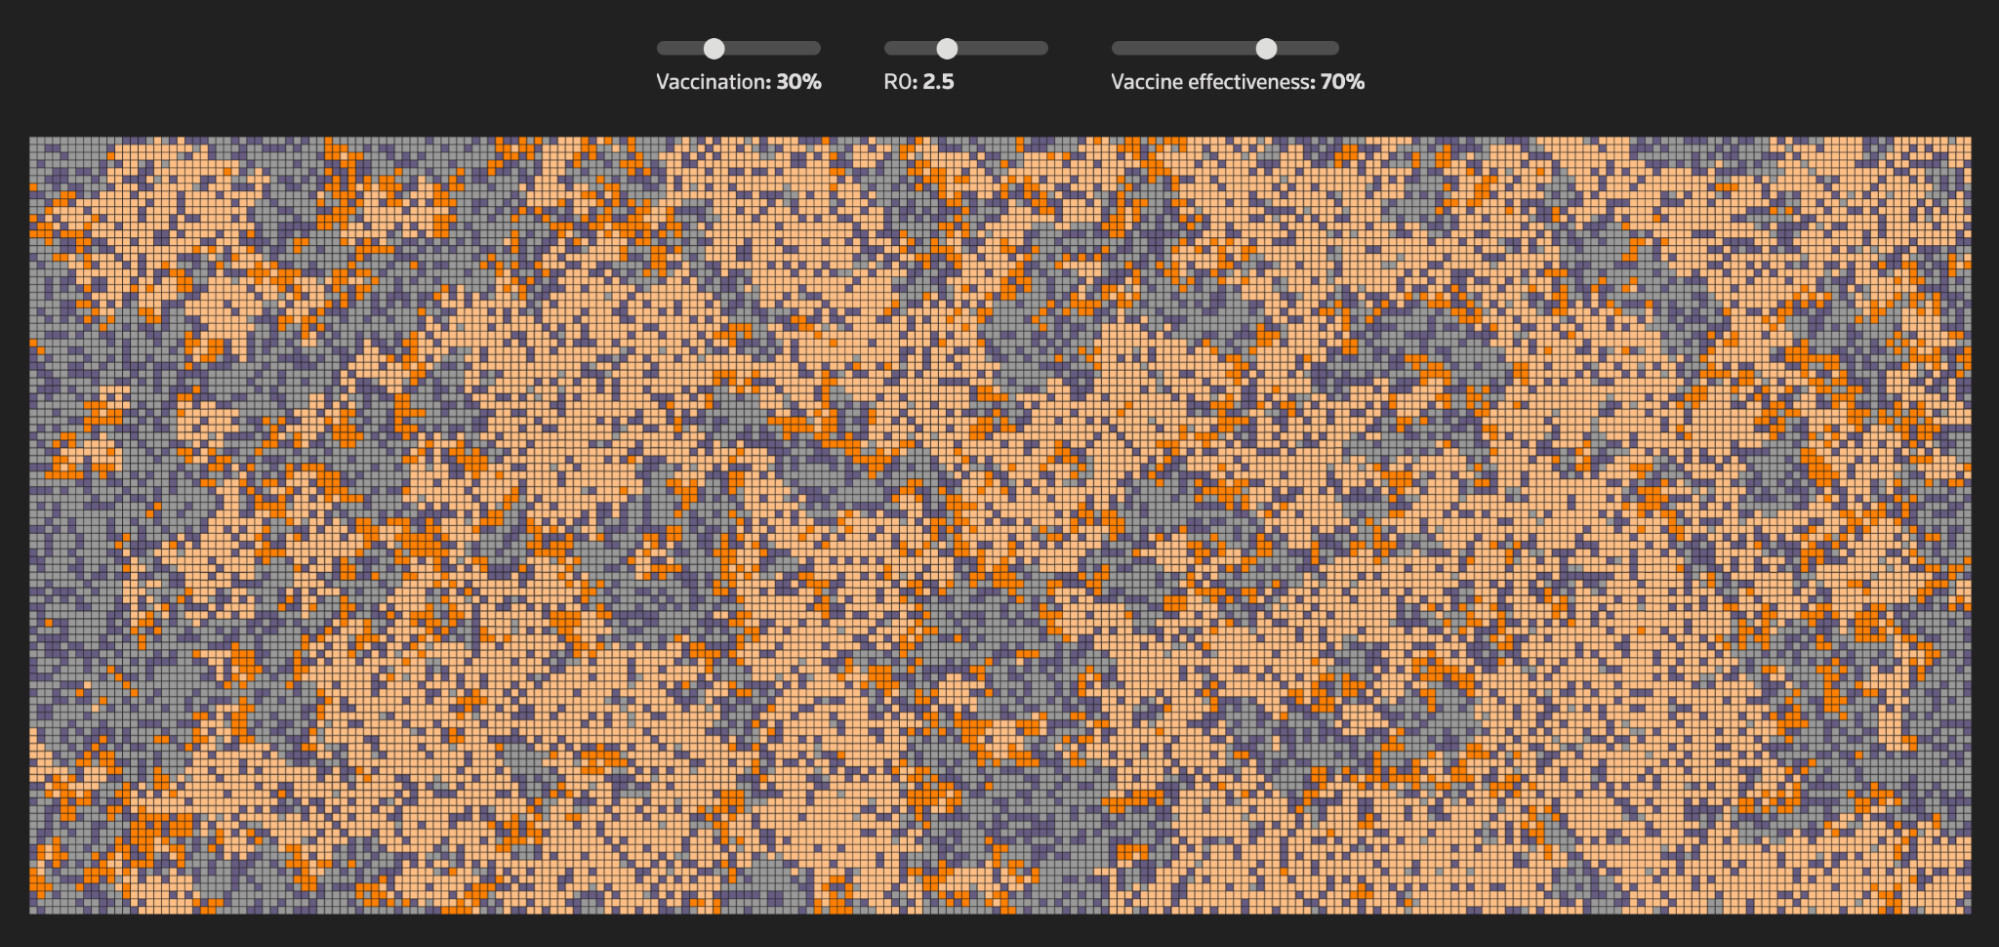
Perhaps more unique to predictive journalism are the cases where interactivity allows the user to modify the inputs or parameters of a model. For instance, the New York Times piece about covid case counts shown in the last section allows users to drag an indicator for when interventions such as social distancing are deployed to see how that might affect outcomes.66 Users can also interactively set the intensity of the interventions from mild to modest or aggressive, allowing them to compare different scenarios of levels of intervention. David Byler described his project for RealClearPolitics that let users enter the vote share and turnout figures for the 2016 election and then simulate how that might affect the outcome. “People found uses for it that I didn’t expect…putting slightly absurd scenarios into [it],” he said, adding that people would email him the creative scenarios they had devised to put their candidate over the top or flip a state one way or the other. Another example of this type of interactivity, from Reuters, first presents a number of scenarios of covid spread under varying conditions of vaccination, landing finally on an interactive version that allows the user to explore the impact of three parameters: vaccination rate, R0, and vaccine effectiveness.67 The journalists here aren’t presenting a single prediction, but creating a prediction machine that is tweakable and explorable by the user.
Credit: Reuters
As described earlier for the Post’s Opinion Simulator project, some pieces of predictive journalism also invite users to make their own predictions. In the realm of sports, the NFL season predictions from FiveThirtyEight allow users to preordain the outcomes of games for the coming weeks, updating the rest of the predictions in the display as a result.68 Another nice example of this is Time magazine’s Oscars predictor, which asks users to rate the chances that each of the nominees for Best Picture will win the award.69
Afterward, users can compare their predictions against those from the statistical model, even trading off how to weight their own predictions in a joint prediction. Engaging users in this way allows them to make their own intuitive predictions to compare against the model’s prediction, offering an opportunity for learning by getting feedback on their expectations.
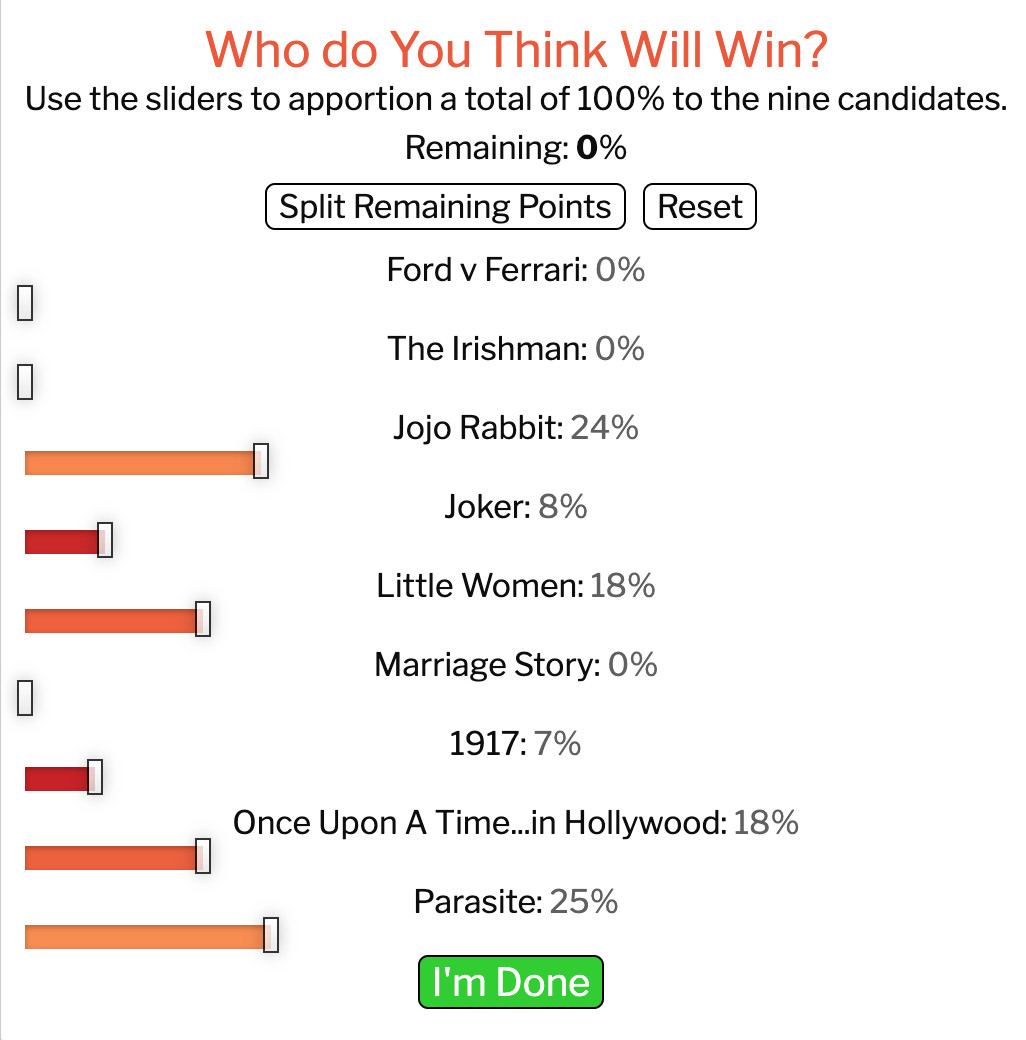
Credit: Time Magazine
Uncertainty
Uncertainty communication is a crucial aspect of predictive journalism. Since predictions driven by computational methods are probabilistic claims, they’re never perfectly certain. The examples analyzed showed that journalists communicated a range of types and magnitudes of uncertainty in numeric, textual, and visual modalities. Uncertainty could be conveyed directly about predictions themselves (e.g., error bars), or indirectly about the quality of the evidence producing the predictions (e.g., assumptions and data limitations).70
Direct uncertainty communication was observed in visualizations of probability distributions, error bars and uncertainty intervals, low to high ranges, and predefined categories of uncertainty (e.g., “very likely”). Many of these are visible in examples in the “Predicting Elections” section above.link1 A common visualization technique was to include uncertainty intervals around the point estimate of a prediction, such as seen in the earlier figurelink2 of The Economist’s US election prediction. The New York Times election needle uses shading as well as set labels ranging from “very likely” to “likely” to “leaning” to “tossup” to textually indicate the level of certainty with the prediction. Another mechanism used to convey uncertainty is the presentation of multiple scenarios that explore plausible parameters for a simulation. This subtly conveys that maybe the journalists aren’t sure which scenario is likely, instead showcasing the range of possible outcomes. Uncertainty communication can also be contextualized in interactive visualizations. For instance, The Economist’s covid comorbidity risk estimator71 uses shading on the chart to indicate the confidence interval of the risk estimate of hospitalization and death, but adds a label when hovering over the chart to indicate when an estimate is “uncertain” or “highly uncertain.”
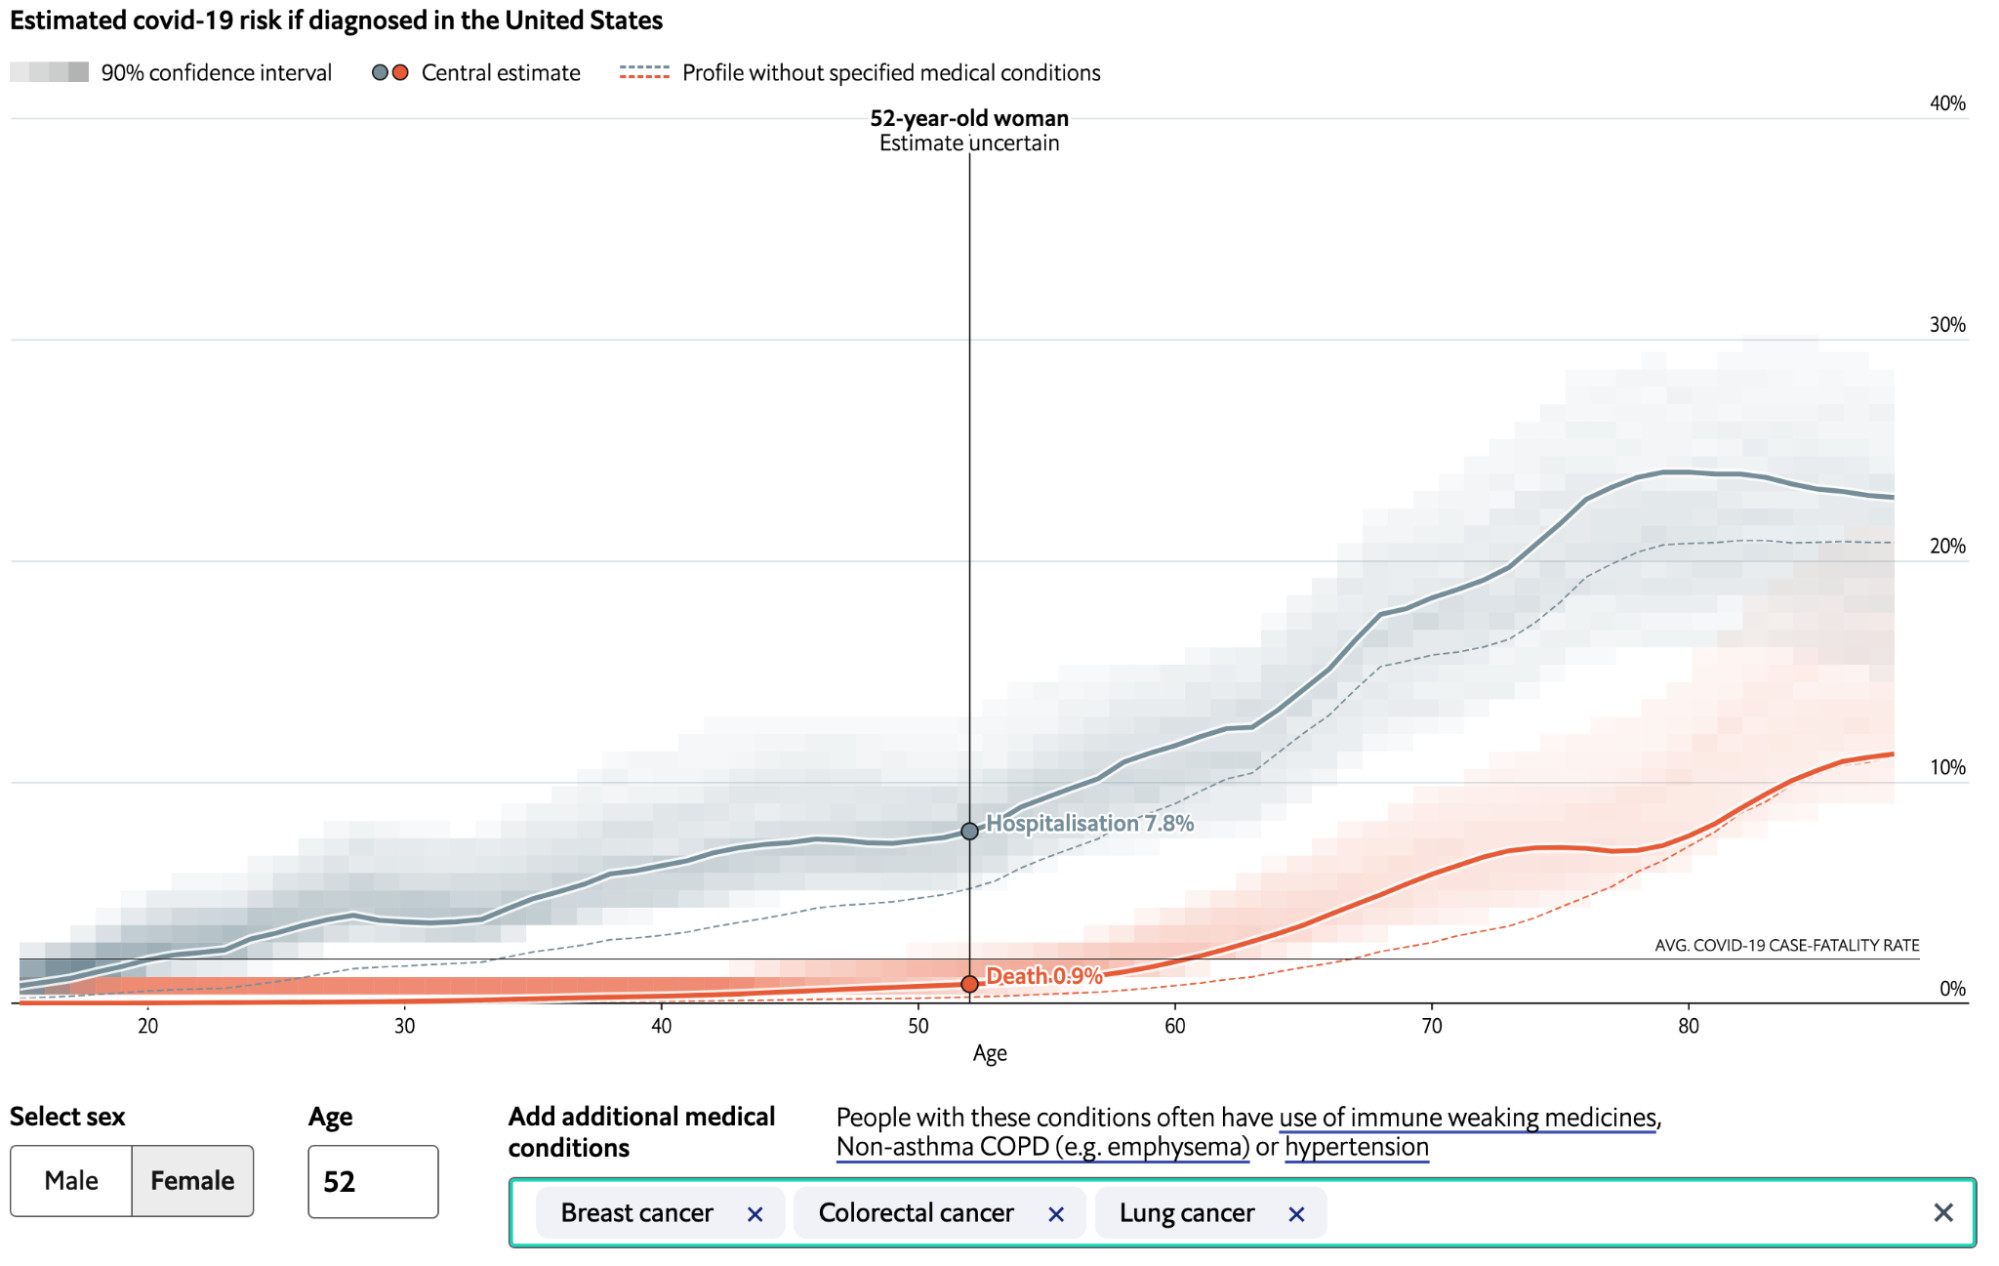
Credit: The Economist
Indirect uncertainty is, again, about the limitations of a model or its data that create uncertainty. It is typically communicated in textual form. For instance, in his Swing Seat work, David Byler included an extensive bullet-pointed list of “What are the model’s blind spots?” to underscore what could go wrong with the predictions.72 At times, disclaimers are included at the end of articles to hedge and convey some of this indirect uncertainty, detailing how various uncertain parameters in the model could affect outcomes.73 In a few cases of covid prediction, journalists distanced themselves from making claims that might be perceived with any authority about the pandemic itself, opting to simulate mock diseases like simvid-19 (NPR)74 or Simulitis (Washington Post).75 The Washington Post claimed that “Simulitis is not Covid-19, and these simulations vastly oversimplify the complexity of real life.” NPR indicated that “We’ve chosen to simulate a fake disease since there are too many unknowns to simulate the course of covid-19.” These pieces function as illustrations of the principles of social distancing or herd immunity rather than as a forecast about the specific outcomes of vaccination or other policy measures related to covid. In some cases there may simply be too much indirect uncertainty to have a model provide evidence for specific forecasts. In these cases journalists do not want readers to understand the predictions as information they should act upon, but rather to see them as illustrations to learn from in a more abstract sense.
Transparency
Transparency in this context means the disclosure of additional information about a prediction to help others understand how that prediction was made.76 The examples analyzed incorporated transparency information of different sorts and varieties. When leveraging a third-party model, articles consistently identified the source, including the organization or individuals responsible for creating the model. When creating their own models, predictive journalists included information about the mechanics of the modeling process such as assumptions (e.g., duration of immunity), definitions (e.g., what constitutes an “aggressive” covid intervention scenario), data (e.g., polls and their sources), parameters (e.g., vaccine effectiveness, start date of simulation), or type of model (e.g., random forest), and model evaluation (e.g., cross-validation).77 In a few cases, such as The Economist’s 2020 US president forecast or the Washington Post’s live election-night model, a link to source code was included and an academic paper was published further explaining the model. On the other hand, the 2020 FiveThirtyEight forecast, while it included a high level of transparency on every aspect of the model including access to the underlying data, stopped short of disclosing the actual code used to implement the forecast.78
In some cases transparency included interpretive guidance, such as temporal context (e.g., version history, change log, update frequency, whether it was still being updated), how not to interpret the predictions, and whether there were errors or mistakes identified. In some cases there were clear warnings or disclaimers communicated, such as The Economist’s covid risk estimator (shown in the last section),79 which included the following statement:
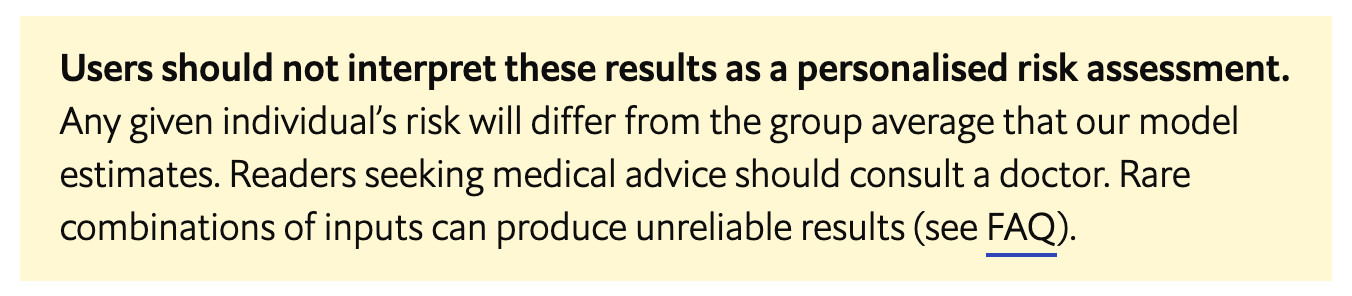
The Economist also provides an example of how to run a correction for a predictive model. Apparently there was a bug in some of the code for the 2020 US president model when it was first published. After it was detected and fixed they issued a correction appended to the bottom of their methods article80 indicating how the bug affected the prediction: “These changes caused Joe Biden’s chances of winning the popular vote and electoral college to each decrease by roughly two percentage points.”
Another interesting aspect of transparency that was included in some examples was a description of the intentions of the authors in publishing the prediction. For instance, FiveThirtyEight presents a justification for why they publish their presidential approval prediction premised on the political relevance of that number: “If it’s possible to sum up a presidency in a single number, that number would be the president’s approval rating—or the share of Americans who approve of the job he’s doing. Arguably, that simple percentage can determine the fate of an entire presidency.”81 The Economist is even more explicit in some cases, such as in the covid risk estimator, where they actually include an FAQ section on the page with a response to the question “Why did you build it?,” explaining the goals as raising awareness for the combined comorbidity risks associated with covid. The Post Opinion Simulator describes its intent as letting “you explore how the candidates’ fortunes could rise or fall, depending on what you think will change with their polling and fundraising.” These descriptions of intentions help frame the utility that journalists expect users to gain through their engagement. But there were also many examples that did not attempt to explain the intent of their predictions or that left those intentions more implicit. For instance, many of the FiveThirtyEight sports predictions made no attempt at motivating their relevance, though sports fans might see that relevance as self-evident.
In terms of the interface, various presentation options shape the salience of transparency information by varying its position and mode of access. Sometimes transparency information was integrated directly into a presentation by interleaving it in the text, while other times it was added at the top or bottom of a page, or linked to as a full-fledged separate article with possible further outlinks to code repositories or academic articles for specialist audiences. Interactivity was sometimes necessary to reveal details such as by clicking to expand a methods box or follow a link. For instance, the Radio Canada piece referenced earlier82 allows the user to click at the end of the article to expand an information panel that shows details about the data used, how the model was developed, and the source of the model.
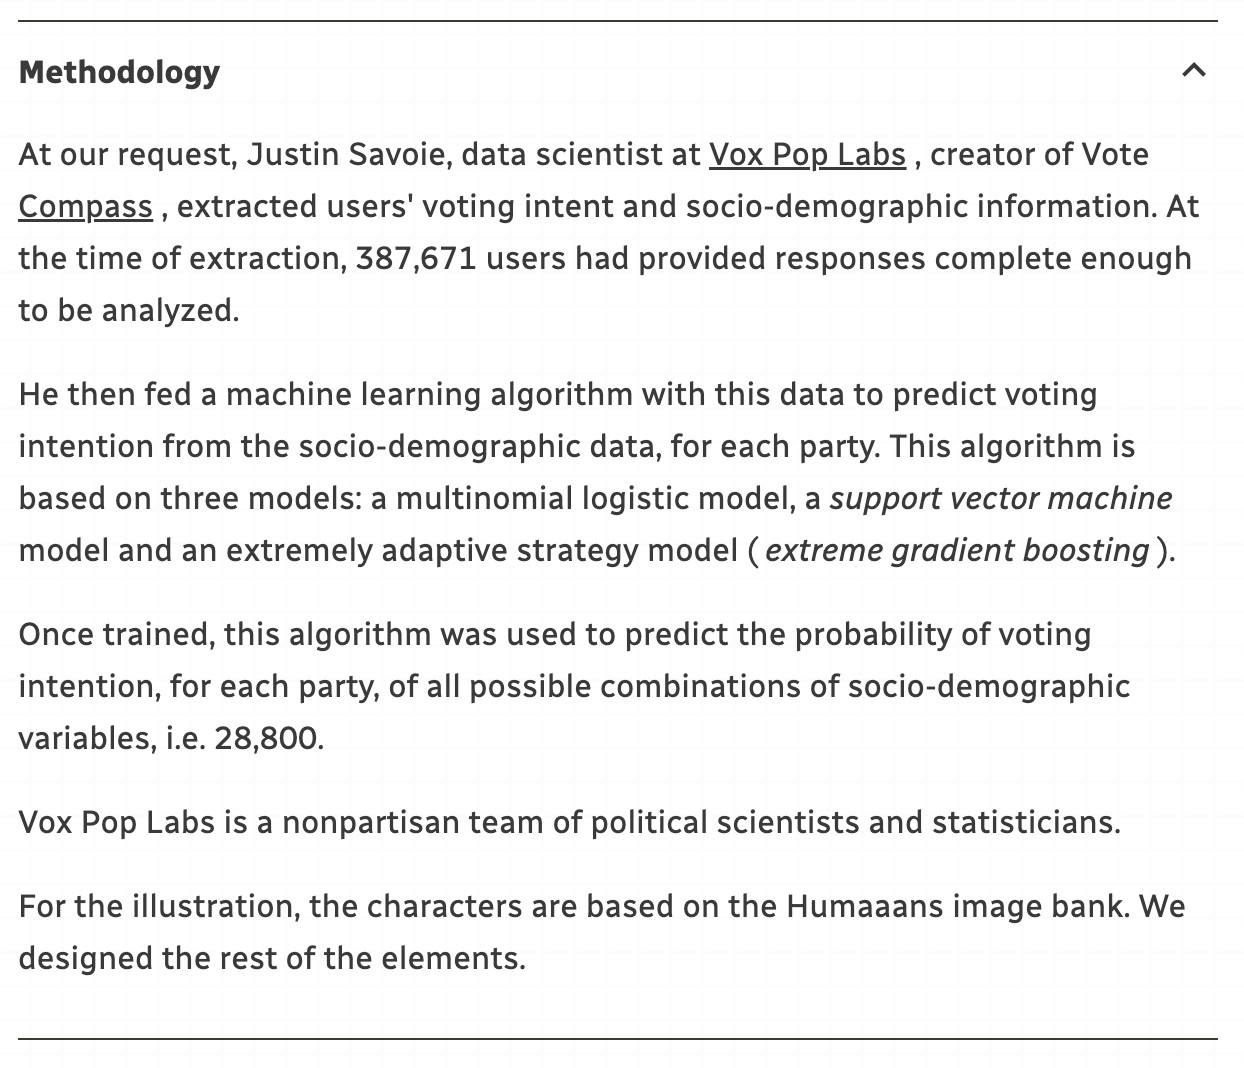
Credit: Radio Canada
Toward Responsible Prediction
The final leg of this report is a synthesis of observations with the goal of articulating initial steps toward making the practice of predictive journalism responsible. What should be the ethics and expectations for predictions produced by journalists? In large part, this boils down to how to translate ethical commitments to core journalistic principles of accuracy, verification, independence, and transparency. To do this, in the following sections I’ll elaborate on the need to consider how predictions may influence attitudes and behavior, to ensure appropriate reception and interpretation of forecasts, and to implement rigorous editing protocols that acknowledge the limits of prediction and of the journalists doing it.
Influence and Feedback
In some low-stakes entertainment contexts, like predicting medals for the Olympics or winners of the Oscars, the impact of published predictions may be negligible. But an election prediction that influences voting patterns and affects democratic outcomes may be undesirable, as might a pandemic prediction that could cause people to let down their guard prematurely and thus perpetuate the pandemic. A guiding belief in supporting human agency might call for publishing predictions regardless of impacts. As Micah Cohen explained, “The mission is to give people better information, and we can trust people to do with that what they will…everybody gets to make their own decision.” Journalists of course publish all kinds of information that may influence how people understand and take action in the world—for better or worse.83 The key difference here is that predictions are tentative—their accuracy is not incontrovertible. Therefore, I argue that when identifying and designing predictive journalism projects, news organizations should be thinking explicitly about the social dynamics of predictions and how they might be used by readers and potentially factor into downstream decisions at the individual or societal level.84 What are the risks of a prediction missing the mark, high or low? Adopting approaches from anticipatory ethics,85 such as scenario building around potential impacts, could inform the design of predictive journalism projects to help guard against potential harms that are foreseeable.
Another important challenge for predictive journalists is to consider feedback effects and how to uphold the principle of independence, a key tenet of journalism ethics.86 Journalists designing predictive projects should consider potential routes through which their predictions could influence the system they seek to forecast.87 For example, as Lenny Bronner at the Washington Post said, “We don’t show our model until polls have closed [in the state].” This ensures there can’t be a feedback loop that could serve to amplify or dampen the voting process. As mediators in many social processes, journalists need to be sensitive and self-reflexive to that role and how their predictions might shape the very data sources they use for prediction. Another dimension of independence considers whether a journalist’s predictions can be manipulated by other motivated parties who might shape the data input into their models. It would clearly be problematic if predictions could be gamed because they use data that powerful actors can influence.
It’s a positive sign that some journalists and outlets are already thinking about the intent of their work and why you might want to present a prediction to a reader, such as FiveThirtyEight’s description of why they publish a Biden approval forecast.88 Journalists should make the articulation of these intentions a key component of the design process to create a baseline expectation for how they expect users to use the information published. If it turns out through pre- or post-publication user evaluation that those design intents are violated, journalists might add disclaimers or otherwise guide users toward appropriate use of the predictions. For instance, when Elliott Morris of The Economist told me that “we’re trying to affect the conversation about the likelihood of unlikely events in a statistically rigorous way,” this might suggest an evaluation of how the Economist presidential forecast is affecting that conversation and whether that impact is productive from the perspective of democracy. If uncertainty in the model is too great to risk people taking action based on it, another option would be to create an analogue like the Simulitis or simvid-19 examples, which can be clearly read as an illustration rather than as a map that might influence behavior.
Appropriate Interpretation
“Does 70 percent mean 100 percent? Does 90 percent mean 100 percent? No.” reads the FAQ page for the New York Times’ 2020 election needle, which puts some clear guardrails around potential misinterpretation of probabilities.89 But given that many people have difficulty accurately interpreting statistics and probabilities and might not read the FAQ before consuming the prediction, one could reasonably wonder why the Times’ warning wasn’t placed more prominently in the actual presentation of the predictions. Again, one of the key concerns of critics of election prediction is that a vote share percentage (e.g., 52 percent) might be easily confused with a win probability percentage (e.g., 71 percent). Appropriate interpretation is about how to guide readers—all kinds of readers, with varying levels of numeracy—toward an accurate meaning of the numbers and of the uncertainty around them. In addition to critical self-reflection on how to prevent misinterpretation,90 news organizations might also create statistical literacy programs (perhaps similar to “What’s Going On in This Graph”91) to advance these goals in general. As Micah Cohen put it, “I think the answer is to try to improve people’s understanding of the probabilities…and not just be like, ‘Okay, we’re not going to do that.’” The ultimate goal is audience understanding, and journalism (not only predictive journalism) needs to get serious about evaluating itself by that standard.
Appropriate interpretation can be supported in a few ways. For one, transparency information should be standardized and presented in multiple modalities to users so that they can access it at the level of detail that helps them make sense of it. In short, journalists need to provide usable transparency, which considers how people (and different types of people) might use transparency information in context.92 While the examples reviewed cover a wide range of transparency information, models of algorithmic transparency can help formalize the different dimensions that could be disclosed about a model and its data.93 Providing transparency information across a range of formats can also lead to meaningful engagement with different audience constituencies. For instance, Lenny Bronner at the Washington Post described how by posting their live model code to Github, a statistician at Stanford reached out and suggested an idea for an alternate method that led to more precise uncertainty estimates for the prediction.
Another way to support appropriate interpretation is by presenting uncertainty information alongside predictions.94 Recent research—including a field deployment on the BBC News site—has shown, for instance, that numeric representations of uncertainty (e.g. a point estimate and range) effectively convey uncertainty but don’t affect the trustworthiness of the numbers or the source of the numbers (i.e. the journalist), while other approaches, such as adding “estimated” or “about” before a number, are not effective.95 Journalists should continue to innovate in probabilistic storytelling,96 but should combine those innovations with evaluation standards for how uncertainty is received by their audiences. Design processes might also explicitly consider how motivated reasoning around polarized topics may impact interpretation, and how designs might avoid that.97 One specific design intervention to consider might be to ensure that if the display uses terms like “likely” or “uncertain,” these are precisely defined so that users are calibrated to the choice of language, otherwise they may understand those terms differently.98 Another approach is to communicate the same thing in multiple ways, such as with a visualization, numerically with text and context, and by making a familiar analogy, as when FiveThirtyEight compared Trump’s 1-in-10 odds of winning to the chance of rain in Los Angeles. When interfaces are highly interactive and users can play with parameters to create their own scenarios, journalists should also provide reasonable defaults and bounds on those parameters so that users aren’t left to create a scenario that’s impossible or so implausible or uncertain as to be misleading. It’s important for defaults to be well researched and grounded in the best evidence for those choices.99
Appropriate interpretation also applies to how journalists rely on predictive models as sources, including from other news organizations. Since predictive journalism can influence downstream coverage, helping journalists understand and report on predictive models as a source is crucial. The American Association for Public Opinion Research (AAPOR) Code of Ethics offers an in-depth guide on how to report on polls that could perhaps serve as a basis for adapting to how to report on computational models.100 An additional piece of documentation that predictive journalists (or other sources) could provide is a guide on “How to write about this prediction,” with suggestions that help ensure key transparency and uncertainty information is carried through to the framing written into downstream coverage. In general, journalists are not always so critical of the statistical methods behind quantitative claims, often relying on source authority and corroboration.101 But to guard against inconclusive or misguided evidence from predictive models gaining unwarranted purchase in their reporting,102 journalists should develop skills for thoroughly vetting the predictive models they report on, ensuring that they reflect the potential bias or uncertainty present in the source as they place it in context with information produced through other methods.
Editing
Just as for third-party models, journalists need to be comfortable vetting and editing their own models so that they can be responsible publishers. Editing a predictive journalism project can take several forms, including knowing how to assess and evaluate the prediction to backtest it or update it in response to feedback, as well as being cognizant of limitations of the predictive mindset and knowing when not to publish.
The case of FiveThirtyEight’s election-night model in 2018 is a good example of where more careful editing might have averted some of the swings in the predictions that may have briefly impacted the US bond market. At the Washington Post, editors installed checks on their live election night model before it was published. Some of those are basic statistical checks, like making sure that the point estimate is covered by the model’s prediction interval. If a test like that isn’t met, then something really wrong is going on with the statistics. They only start reporting a prediction after at least one full county in a state has fully reported its results, as a way for capturing whether there is anything drastically different going on in the state results in comparison to past elections. The model is also backtested in real time as results come in from precincts, to evaluate what it would have predicted at that time in the evening for each of the last five elections. Because of this check, the Post model’s prediction wasn’t published for Nevada or Arizona in 2020 despite editorial interest in doing so. Part of evaluating and editing can also come after a prediction has been published, but particularly for live predictions as much of the editing and evaluation should happen ahead of time as possible. At the Post, editors used a Slack channel to monitor the predictions and feedback if it looked like anything was amiss. “We had set out a set of criteria so that we didn’t have to sort of make ad hoc decisions on the night of,” said Bronner.
Responsible editing of predictive journalism involves knowing the limitations—both the model’s, and your own. Neither the Washington Post nor FiveThirtyEight published their own predictions around the evolution of covid-19. They were both thoughtful enough to know that they lacked the expertise to do it justice. “A lot of it has to do with domain expertise and being able to know what can go wrong and how,” said Bronner. For FiveThirtyEight, this shifted the approach to coverage: “There were already people publishing forecasts, so we felt like we could add more value in helping people interpret those forecasts,” said Cohen. More generally, situating predictive journalism within a mature newsroom can provide the perspective and context to know when other methods might be better suited for answering a particular question. “The danger is if your model is bad or if you don’t have the good judgment to know what your model is saying, and you don’t have the other expertise to know how else to describe the world,” said Byler. This includes knowing what not to predict because it might be ethically wrong (e.g., predicting the death of an aging political figure), because it hinges on individual human decisions (e.g., whether a dictator will invade a neighbor), or just because it’s something that is inherently unpredictable.
Recommendations for Future Work
The ethical goals of managing the influence and appropriate interpretation of published predictions suggest a strong need for news organizations to invest in user-centered evaluation of their predictive projects. This should be done in addition to the kinds of evaluations they’re already doing on the statistical models developed.103 There are numerous gaps and opportunities for future research related to how people perceive and make sense of predictions—including related uncertainty and transparency information—that could inform responsible and careful use by journalists.
A common refrain in newsrooms is that there aren’t adequate resources to do this kind of research in-house. While the Washington Post did some user testing, efforts at The Economist and FiveThirtyEight were more ad hoc. To help alleviate the resource limitations, I recommend that predictive journalists partner with experts in human-centered design and evaluation at universities to help evaluate projects before and after they’re launched. These types of collaborations already exist for predictive journalists working on statistical models, and this should be extended to working on the front end of how predictions are communicated and how various stakeholders understand and act on them. More specifically, I recommend that such work includes surveying users about how predictions are used in their lives or decision-making, interviewing people to understand whether predictions have changed their attitudes or mental models, and analyzing content and coverage of predictive journalism to assess how uncertainty and framing is taken up (or not) by downstream media. Testing deployed systems could evaluate and compare different approaches to communicating uncertainty, and how presentations are impacting understanding.
I also recommend starting to standardize editorial processes and training on how to vet a model and its prediction for publication. This would yield benefits for assessing third-party models in reporting as well as for editing home-grown models to ensure their utmost reliability, even in time-pressured situations like election night predictions. Given the unique form of statistical models as sources of information that are bound up in choices of data, methods, and uncertainty, addressing model vetting processes would help journalists better understand how to ethically and responsibly create, publish, and critique predictions.
This report was focused on the publication and presentation of predictions to audiences. But behind the scenes there are a variety of other ways in which prediction may be subtly shaping the media, whether that’s A/B headline testing potentially shaping how journalists write headlines over time,104 computational news discovery tools that may nudge journalists in particular directions,105 or other ways in which a model takes past data to suggest a decision that shapes the future. There are important questions that I also recommend pursuing here in terms of the long-term impacts on media coverage that may come about as a result of predictions internal to the newsroom shaping journalists’ choices and coverage decisions.
Predictive journalism, driven by data and computational modeling, brings the credibility of sound evidence to predictions about the future, but because of its extrapolative approach it may also limit the media’s ability to shape the future in other deliberate normative ways. Yet predictive journalism can also operate as a substrate on top of which other informed analysis and opinion reporting can be layered to explore the future. In this sense, I recommend that journalists continue to innovate in interpretive practices around computational predictions that can incorporate other normative or aspirational visions of the future into journalism. Moreover, practice should continue to explore and innovate ways for predictive journalism to operate as an explanatory device to help audiences understand deeply complex systems in society.
Conclusions
This report argues for the development of a responsible journalistic practice of prediction and works toward articulating what that might entail. I first define what we mean by predictive journalism, outlining its basis in computational methods that can help to rigorously inform projections about the unknown. Through illustrations in the domain of elections I outline some of the potential uses and challenges with this genre, drawing on interviews with key practitioners. Then I pivot toward a broader view, presenting a content analysis of predictive journalism examples that articulates specific value around communicating predictions and explanations, enabling analysis through counterfactuals and critiques, and informing downstream news coverage. I elaborate how predictive journalism works in practice via interactive interfaces and by leveraging the communication of uncertainty and transparency information. Drawing on all of these observations, I synthesize key areas where a responsible practice of prediction can be further developed: considering how predictions may influence users, ensuring their appropriate reception and interpretation, and developing rigorous editing protocols for sourcing and publishing predictions. Finally, I offer recommendations for future work in this domain, arguing for the need to invest in user-centered evaluation, partner with academic institutions, develop standards for vetting models prior to publication, research other ways in which predictions shape internal workflows, and develop innovative practices that effectively leverage predictions as part of an interpretive and explanatory endeavor.
Acknowledgments
I would like to thank Kiara Villalobos-Hernandez for her help in curating the dataset of predictive journalism examples. I would also like to thank Mowafak Allaham, Pete Brown, Matthew Kay, Benedict Witzenberger, and Fumeng Yang for their helpful feedback in the revision process for this report.
Footnotes
1. Pentzold C, Fechner DJ and Zuber C (2021) “Flatten the Curve”: Data-Driven Projections and the Journalistic Brokering of Knowledge during the COVID-19 Crisis. Digital Journalism: 1–24↩
2.https://www.nytimes.com/interactive/2020/03/13/opinion/coronavirus-trump-response.html↩
3.https://www.npr.org/sections/health-shots/2021/01/28/960901166/how-is-the-covid-19-vaccination-campaign-going-in-your-state↩
4.Szpunar KK, Spreng RN and Schacter DL (2014) A taxonomy of prospection: Introducing an organizational framework for future-oriented cognition. Proceedings of the National Academy of Sciences 111(52): 18414–18421.↩
5.Dean Buonomano. Your Brain Is a Time Machine: The Neuroscience and Physics of Time. W. W. Norton & Company.↩
6.Carroll JS (1978) The effect of imagining an event on expectations for the event: An interpretation in terms of the availability heuristic. Journal of Experimental Social Psychology 14(1): 88–96.↩
7.Thorstad, R. & Wolff, P. A big data analysis of the relationship between future thinking and decision-making. Proceedings of the National Academy of Science 115 (2018).↩
8.Zelizer B. (2021) Why journalism’s default neglect of temporality is a problem. Media, Culture & Society.↩
9.Barnhurst, K. G., & Mutz, D. (1997, December). American Journalism and the Decline in Event-Centered Reporting. Journal of Communication, 47(4), 27–53.↩
10.Neiger, Motti, and Keren Tenenboim-Weinblatt. 2016. “Understanding Journalism through a Nuanced Deconstruction of Temporal Layers in News Narratives.” Journal of Communication 66 (1): 139–160↩
11.See FiveThirtyEight’s work on evaluating the calibration of their forecasts, i.e. whether events predicted to happen 10 percent of the time turn out to actually happen about 10 percent of the time.↩
12.Westwood, S. J., Messing, S. & Lelkes, Y. “Projecting Confidence: How the Probabilistic Horse Race Confuses and Demobilizes the Public.” The Journal of Politics 82, 1530–1544 (2020).↩
13.National Conference of State Legislatures. Early In-Person Voting. Jan. 2022.↩
14.Zeynep Tufekci. “Can We Finally Agree to Ignore Election Forecasts?” Nov 1, 2020; see also: Toff, Benjamin. 2019. The ‘Nate Silver effect’ on political journalism: Gatecrashers, gatekeepers, and changing newsroom practices around coverage of public opinion polls. Journalism 20 (7): 873–889.↩
15.Jill Lepore. If Then: How the Simulmatics Corporation Invented the Future. Liveright Publishing Corporation. 2020.↩
16.Seymour, Gideon, Archibald Crossley, Paul F Lazarsfeld, and George Gallup. 1949. “Should Public Opinion Polls Make Election Forecasts?” Journalism Quarterly 26 (2). SAGE PublicationsSage CA: Los Angeles, CA: 131–44.↩
17.Strömbäck, Jesper. 2012. “The Media and Their Use of Public Opinion Polls.” In Christina Holtz-Bacha, & Jesper Strömbäck (eds.), Opinion Polls and the Media, 1–22. Basingstoke: Palgrave.↩
18.Seligman, Martin E. P., Peter Railton, Roy F. Baumeister, and Chandra Sripada. Homo Prospectus. Oxford University Press. 2016.↩
19.https://www.merriam-webster.com/dictionary/predict↩
20.Nicholas Rescher. Predicting the Future: An Introduction to the Theory of Forecasting. State University of New York Press. 1998.↩
21.Ajay Agrawal, Joshua Gans, Avi Goldfarb. Prediction Machines: The Simple Economics of Artificial Intelligence. Harvard Business Review Press. 2018. ↩
22.Jennifer L. Castle, Michael P. Clements, David F. Hendry. Forecasting: An Essential Introduction. Yale University Press. 2019; Nicholas Rescher. Predicting the Future: An Introduction to the Theory of Forecasting. State University of New York Press. 1998.↩
23.Nicholas Diakopoulos. Automating the News: How Algorithms are Rewriting the Media. Harvard University Press. June 2019. ↩
24.Previous related work has framed the phenomenon as “predictive data journalism,” which somewhat relaxes the focus on computational methods; see: Pentzold, C. & Fechner, D. “Data journalism’s many futures: Diagrammatic displays and prospective probabilities in data-driven news predictions.” Convergence (2019). For a primer on machine learning see also “What is machine learning and why should I care?”↩
25.Hagar, N., Diakopoulos, N. & DeWilde, B. “Anticipating Attention: On the Predictability of News Headline Tests.” Digital Journalism 1–22 (2021).↩
26.Gelman A, Hullman J, Wlezien C, et al. (2020) “Information, incentives, and goals in election forecasts.” Judgment and Decision Making 15(5).↩
27.Anna Wiederkehr. “How We Designed The Look of Our 2020 Forecast.” FiveThirtyEight. August 13, 2020. ↩
28.For more on the internal debates at The Economist, see “Off the Charts.”↩
29.“Who can win the Democratic Primary?” The Washington Post.↩
30.https://www.economist.com/graphic-detail/2018/11/03/how-to-forecast-an-americans-vote↩
31.https://ici.radio-canada.ca/info/2019/elections-federales/vote-chances-electeur-boussole-influence-choix-parti/↩
32. For more on the distinction between descriptive, explanatory, predictive, and integrative modeling in computational social science, see Hofman, J. M. et al. Integrating explanation and prediction in computational social science. Nature 595, 181–188 (2021).↩
33.Dowding K (2021) Why Forecast? The Value of Forecasting to Political Science. PS: Political Science & Politics 54(1): 104–106.↩
34.Carl Colglazier and Nicholas Diakopoulos. Predictive Models in News Coverage of the COVID-19 Pandemic in the U.S. Informational Communication Association (ICA) Conference. 2022. ↩
35.https://www.economist.com/graphic-detail/who-will-succeed-angela-merkel↩
36.https://www.sueddeutsche.de/politik/bundestagswahl-prognose-vorhersage-1.5385101↩
37.https://www.weeklystandard.com/swingseat-senate-election-model/↩
38.Nate Cohn and Josh Katz. Needle Update: What to Expect on Election Night. Nov 2, 2020. https://www.nytimes.com/2020/11/02/upshot/new-york-times-needle-election.html↩
39.https://www.theverge.com/2016/11/8/13571216/new-york-times-election-forecast-jitter-needle↩
40.https://www.nytimes.com/interactive/2020/11/03/us/elections/forecast-president.html↩
41.https://www.washingtonpost.com/politics/2020/11/01/post-election-model-results/↩
42.Westwood, S. J., Messing, S. & Lelkes, Y. Projecting Confidence: How the Probabilistic Horse Race Confuses and Demobilizes the Public. The Journal of Politics 82, 1530–1544 (2020).↩
43.Colby Smith and Brendan Greeley. “Debt markets let us know what they think about Republicans last night.” Financial Times. Nov. 7, 2018. ↩
44.Isaac Chotiner. “A NYT Reporter on What Happened to the Needle on Election Night.” Slate. Nov 9, 2018. ↩
45.Nate Silver and Galen Druke. “Politics Podcast: How our Forecasts Did In 2018.” FiveThirtyEight. Nov. 15, 2018. ↩
46.Queries included forecast*, projection, estimat*, predict*, model*, simulat*, risk assessment, risk calculation, risk model, hypothetical, potential outcomes, statistical model (“*” indicates that the query included multiple variations of the word; for example, “forecast*” includes “forecast,” “forecasting,” and “forecasts”).↩
47.https://github.com/Sigma-Awards/The-Sigma-Awards-projects-data↩
48.Janice Morse. 2004. “Purposive Sampling.” In The SAGE Encyclopedia of Social Science Research Methods, Michael Lewis-Beck, Alan Bryman, and Tim Futing Liao (eds.). Sage Publications, Inc., Thousand Oaks, CA.↩
49. For the full dataset, see here: https://docs.google.com/spreadsheets/d/1oUnOtK7FofklglONOa5wJWloicICoAcO6IIWoimOtd8/edit#gid=0↩
50.Though published before COVID-19, related work finds a similar emphasis on politics as the topic of much predictive data journalism; see: Pentzold, C. & Fechner, D. Data journalism’s many futures: Diagrammatic displays and prospective probabilities in data-driven news predictions. Convergence (2019).↩
51.See: Loosen W, Reimer J and Silva-Schmidt FD (2017) Data-driven reporting: An on-going (r)evolution? An analysis of projects nominated for the Data Journalism Awards 2013–2016. Journalism 21 (9): 1246-1263, and Zamith, Rodrigo (2019) Transparency, Interactivity, Diversity, and Information Provenance in Everyday Data Journalism. Digital Journalism 7 (4): 470–489↩
52. Graham R Gibbs. 2007. Analyzing qualitative data. Sage Publications: London.↩
53.https://www.nytimes.com/interactive/2021/04/17/travel/flying-plane-covid-19-safety.html↩
54.https://www.npr.org/sections/health-shots/2021/02/18/967462483/how-herd-immunity-works-and-what-stands-in-its-way↩
55.See also: Bles, A. M. van der et al. Communicating uncertainty about facts, numbers and science. Royal Society Open Science 6, 181870 (2019).↩
56. Pentzold C, Fechner DJ and Zuber C (2021). “Flatten the Curve”: Data-Driven Projections and the Journalistic Brokering of Knowledge during the COVID-19 Crisis. Digital Journalism: 1–24. ↩
57.https://projects.fivethirtyeight.com/soccer-predictions/↩
58.https://www.economist.com/graphic-detail/2021/05/30/covid-19-deaths-in-wuhan-seem-far-higher-than-the-official-count↩
59.https://www.usatoday.com/in-depth/news/investigations/2020/06/29/real-estate-millions-more-homes-risk-flood-might-need-insurance/3217450001/↩
60.https://www.nytimes.com/interactive/2020/04/22/upshot/coronavirus-models.html↩
61.https://www.nytimes.com/interactive/2020/03/13/opinion/coronavirus-trump-response.html↩
62.https://www.nytimes.com/interactive/2021/01/24/us/covid-vaccine-rollout.html↩
63.https://www.bloomberg.com/graphics/tesla-model-3-vin-tracker/↩
64.https://fivethirtyeight.com/features/bidens-declining-approval-rating-is-not-just-about-afghanistan/?ex_cid=biden-approval↩
65.Zamith, Rodrigo. 2019. Transparency, Interactivity, Diversity, and Information Provenance in Everyday Data Journalism. Digital Journalism 7 (4): 470–489↩
66.https://www.realclearpolitics.com/articles/2015/08/26/demographics_and_the_2016_election_scenarios.html↩
67.https://graphics.reuters.com/HEALTH-CORONAVIRUS/HERD%20IMMUNITY%20(EXPLAINER)/gjnvwayydvw/↩
68.https://projects.fivethirtyeight.com/2021-nfl-predictions/↩
69.https://time.com/5779417/oscars-best-picture-prediction/↩
70.Bles, A. M. van der et al. Communicating uncertainty about facts, numbers and science. Royal Society Open Science 6, 181870 (2019).↩
71.https://www.economist.com/graphic-detail/covid-pandemic-mortality-risk-estimator↩
72.https://www.weeklystandard.com/swingseat-senate-election-model/
73.https://www.nytimes.com/interactive/2021/08/12/science/covid-delta-breakthrough.html↩
74.https://www.npr.org/sections/health-shots/2021/02/18/967462483/how-herd-immunity-works-and-what-stands-in-its-way↩
75.https://www.washingtonpost.com/graphics/2020/world/corona-simulator/↩
76.Nicholas Diakopoulos. Transparency. In Oxford Handbook of Ethics and AI. Eds. Markus Dubber, Frank Pasquale, Sunit Das. May 2020.↩
77. Diakopoulos, N. & Koliska, M. Algorithmic Transparency in the News Media. Digital Journalism 5, 1–20 (2016).↩
78.https://fivethirtyeight.com/features/how-fivethirtyeights-2020-presidential-forecast-works-and-whats-different-because-of-covid-19/↩
79.https://www.economist.com/graphic-detail/covid-pandemic-mortality-risk-estimator↩
80.https://projects.economist.com/us-2020-forecast/president/how-this-works↩
81.https://projects.fivethirtyeight.com/biden-approval-rating/↩
82.https://ici.radio-canada.ca/info/2019/elections-federales/vote-chances-electeur-boussole-influence-choix-parti/↩
83.See work on the social reactance of publications of college rankings, for instance: Espeland WN and Sauder M (2007). Rankings and Reactivity: How Public Measures Recreate Social Worlds. American Journal of Sociology 113(1): 1–40. ↩
84.Tenenboim-Weinblatt. Media Projections and Trump’s Election: A Self-Defeating Prophecy? In: Trump and the Media. Eds. Pablo Boczkowski and Zizi Papacharissi. MIT Press. 2018; Also see: Raftery, A. E. Use and communication of probabilistic forecasts. Statistical Analysis and Data Mining: The Asa Data Science Journal 9, 397–410 (2016). ↩
85.Brey, P (2017) Ethics of emerging technology. In Hansson, SO (ed.) Methods for the Ethics of Technology: Methods and Approaches. London; New York: Rowman & Littlefield International, pp. 175–192.↩
86.Fred Brown. Media Ethics: A Guide for Professional Conduct. Society of Professional Journalists Foundation. 2020. ↩
87.Bradshaw, Paul. 2015. Data Journalism. In Ethics for Digital Journalists: Emerging Best Practices, edited by Lawrie Zion and David Craig. Routledge.↩
88.https://fivethirtyeight.com/features/how-were-tracking-joe-bidens-approval-rating/↩
89.Nate Cohn and Josh Katz. “Needle Update: What to Expect on Election Night.” Nov 2, 2020.↩
90.Nate Silver. “The Media Has a Probability Problem.” FiveThirtyEight. Sep. 21 2017. ↩
91.https://www.nytimes.com/2021/07/28/learning/introduction-to-whats-going-on-in-this-graph.html↩
92.Nicholas Diakopoulos. Transparency. In Oxford Handbook of Ethics and AI. Eds. Markus Dubber, Frank Pasquale, Sunit Das. May, 2020↩
93.Mitchell, M. et al. Model Cards for Model Reporting. Proceedings of the Conference on Fairness, Accountability, and Transparency (2019).↩
94.Morris, G. Elliott. The dos and don’ts of predictive journalism. DataJournalism.com, Nov 14, 2019.↩
95.van der Bles AM, van der Linden S, Freeman ALJ, et al. (2020) The effects of communicating uncertainty on public trust in facts and numbers. Proceedings of the National Academy of Sciences 117(14): 7672–7683.↩
96.Pentzold C and Fechner D (2021) Probabilistic Storytelling and Temporal Exigencies in Predictive Data Journalism. Digital Journalism: 1–22.↩
97.Dieckmann, N. F., Gregory, R., Peters, E. & Hartman, R. Seeing What You Want to See: How Imprecise Uncertainty Ranges Enhance Motivated Reasoning. Risk Analysis 37, 471–486 (2017).↩
98.Spiegelhalter, D., Pearson, M. & Short, I. Visualizing Uncertainty About the Future. Science 333, 1393–1400 (2011).↩
99.Diakopoulos, N. Ethics in Data-Driven Visual Storytelling. Data-Driven Storytelling. Eds. N. Riche, C. Hurter, N. Diakopoulos, S. Carpendale. A.K. Peters / CRC Press. March, 2018.↩
100.https://www.aapor.org/Standards-Ethics/AAPOR-Code-of-Ethics.aspx↩
101. Steensberg, M. T. In Numbers We Trust – The Use of Statistics in Political News. Journalism Practice 1–19 (2021); Witsen, A. V. How Science Journalists Verify Numbers and Statistics in News Stories: Towards a Theory. Journalism Practice 1–20 (2021).↩
102. Mittelstadt, B. D., Allo, P., Taddeo, M., Wachter, S. & Floridi, L. The ethics of algorithms: Mapping the debate. Big Data & Society 3 (2016).↩
103.https://projects.fivethirtyeight.com/checking-our-work/↩
104.N. Hagar, N. Diakopoulos, B. DeWilde. Anticipating Attention: On the Predictability of News Headline Tests. Digital Journalism. 2021.↩
105.N. Diakopoulos, D. Trielli, and G. Lee. Towards Understanding and Supporting Journalistic Practices Using Semi-Automated News Discovery Tools. Proceedings of the ACM (PACM): Human-Computer Interaction (CSCW). 2021.↩
Nicholas Diakopoulos is an assistant professor at the Northwestern University School of Communication, the author of the book Automating the News: How Algorithms Are Rewriting the Media, and a regular contributor to CJR.