You rarely see anyone, much less the press, report stock returns in inflation-adjusted terms.
As we pointed out in October when the Dow crossed 10,000 (yet again), that Dow 10,000 was really only Dow 7,714 in original Dow 10,000 (1999) dollars.
But, behold! The Wall Street Journal’s E.S. Browning wrote an important story over the holidays on just this topic—and even took the press to task a bit for its failure to accurately convey reality.
Despite its 2009 rebound, the Dow Jones Industrial Average today stands at just 10520.10, no higher than in 1999. And that is without counting consumer-price inflation. In 1999 dollars, the Dow is only at about 8200 and would have to rise another 28% or so to return to 1999 levels. Using today’s dollars and starting at 10520.10, the Dow would have to surpass 13460 to get back to its 1999 level in real, inflation-adjusted terms.
Bravo!
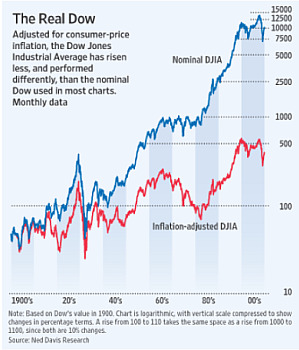
But even better, Browning and the WSJ go back to the turn of the 20th century to show how stocks have really done. The Dow at 10,500 now? It’s more like Dow Sub-500. Seen in that light, equities are a much-less appealing investment than most people think.
Or read this:
Stock analysts sometimes like to note that the Dow today is worth 27 times its value at its 1929 pre-crash peak, meaning that even if you bought at the worst moment, your stock still would be way up over time. In inflation-adjusted terms, however, the Dow today is only a little over twice its 1929 peak, according to Ned Davis Research.
By my math, that means, the Dow has returned 0.99 percent a year over the last 80 years. Yow!
Audit Reader Edwin Hamilton also notes that the Dow has performed miserably over long investment horizons. He calculates that a dollar invested in the stock market in January of 1966 was worth—you guessed it—a dollar in real terms in September of 1995. Worse, that dollar invested in 1966 was worth only about 33 cents in real terms if you happened to cash out in October 1982, just before the great bull market began.
Of course, that (like the WSJ’s 1929 to 2009 number) is measuring from a peak to a trough, which isn’t exactly fair. But even if you measure from the very nadir of the Depression-era Dow, which hit 651 in 1932 (in 2009 dollars. The nominal number was 41.22), you still end up with a real annual return of just 3.7 percent over the last seventy-seven years. You’re not going to get rich on those kind of returns.
So why don’t the media adjust stock returns for inflation? Here’s Browning:
Controlling for inflation takes extra work and makes stock gains look punier, so it is easy to see why stock analysts almost never do it. The media almost never do it either.
I’d guess that the media don’t because they’re mostly talking to people with a vested interest in not presenting the real picture, like those stock analysts or corporate executives. It probably never occurs to most reporters or editors—much less their readers—that the Dow ought to be adjusted for inflation just like a budget number or a food price.
Also, I’d suspect most of us like to see the nominal number increase in our retirement accounts and don’t want to much think about what it’s really worth and how much it’s returned (or hasn’t). As Stephen J. Dubner writes at The New York Times’s Freakonomics blog, “it’s exciting to see inflation working in your favor day after day.”
But it’s really not hard to crunch these numbers, folks. Here’s a really easy tool from the Bureau of Labor Statistics. Plug in your number, pick a date to adjust to, and it will calculate it for you.


So, now someone needs to do the rest of the story. What other investments are doing better? My house? My bonds? Anything?
#1 Posted by Ted, CJR on Tue 5 Jan 2010 at 10:24 PM
I've been wondering about this since enduring my first 401(k) pitch, circa 1991. That guy told us stocks were a can't miss investment & had the big chart going back to the 1960s to prove it.
The other thing I've been wondering about since then is, How can all of us 'mericans retire on our "investment gains" while hardly anyone produces anything of value?
#2 Posted by ed ericson, CJR on Wed 6 Jan 2010 at 08:07 AM
Agreed that inflation should be considered in the stock market. But let's not stop with the stock market. What about gasoline, energy and many other necessities? The Government (and the press) has been telling us for the last few years that inflation is 'low' with a caveat that the number 'excludes gas and energy prices'. How many Americans can 'exclude' them from their budget? What is today's inflation rate when real costs are included?
#3 Posted by dlamour, CJR on Wed 6 Jan 2010 at 10:08 AM
Of course, you are assuming that people put money into the market at one point only , and took it out at another, with no inputs or outputs in between. This isn't exactly how people invest, or spend. For instance, if you have a balanced portfolio, you are shifting stocks, bonds, etc, all the time to mazimize return, and your return will not be the same as your neighbor's, even if you invest the same amount of money. The Dow, whether adjusted or not, is only an indicator.
#4 Posted by Ralph E. Wirtz, CJR on Wed 6 Jan 2010 at 12:28 PM
Ted,
Real Homes included here:
http://homepage.mac.com/ttsmyf/RHandRD.html
ed ericson,
Along the way, I saw Shiller’s work summarized as ‘asset price appreciation is not a retirement strategy’.
dlamour,
Shiller, the WSJ, the NYT, and myself (ttsmyf) all use ‘the full’ CPI-U -- BLS also does a core CPI-U (less food and energy), whose average over time is very close to that of CPI-U. Personally, I am satisfied with the soundness of CPI-U, but some folks are not.
See this paper, published 8/08.
Near the bottom, at
http://www.bls.gov/cpi/cpiqa.htm
download it by clicking on
Find out more in "Addressing misconceptions about the Consumer Price Index" in the August 2008 Monthly Labor Review.
Ralph E. Wirtz,
Please see here
http://homepage.mac.com/ttsmyf
for my determination of the average rate of increase +1.64%/yr compounded annually as the long-term past performance of the Real Dow. I define a best-fit, +1.64%/yr compounded annually curve. The average Real Dow volatility (“+ or – difference of Real Dow from the curve”) is equivalent to ca. 20 years of the 1.64%/yr growth!
#5 Posted by Ed, CJR on Wed 6 Jan 2010 at 01:45 PM
Ralph, here's what I wrote about that:
"These also don’t take into any effects from dollar-cost averaging, which is what you do when you withhold money from at regular intervals for your 401(k), which means you buy at lows and at peaks over a given timeframe."
#6 Posted by Ryan Chittum, CJR on Wed 6 Jan 2010 at 02:45 PM
You ought to consider that, at least for retirement investors, financial planners already calculate an inflation-adjusted income level.
The typical retirement plan is going to call for $XXX,000 by retirement date to produce a nest egg that can produce inflation-adjusted returns for the length of retirement. It's pretty basic part of retirement planning; we learned the formula for inflation-adjusted investment returns in the second week of my first financial planning class.
Likewise, most big investors and corporate entities will compute a required rate of return that includes all kinds of factors, including inflation, to gauge their desired investment outcome.
Stock reporting and Dow-watching is really about nothing more than movement -- up or down, getting better or getting worse. What do I care if the Dow is down, after inflation, compared with 2000? I'm not retiring in the year 2000. An investor with even a rudimentary plan has a goal they are investing to hit and, whether or not they use the Dow as a benchmark, has already accounted for inflation.
#7 Posted by Brian O'Connor/Detroit News Personal Finance Editor, CJR on Wed 6 Jan 2010 at 05:59 PM
Hello Brian O'Connor/Detroit News Personal Finance Editor,
The past was dominantly serial herd behaviors:
http://homepage.mac.com/ttsmyf/RHandRD.html
Individuals’ experiences were overwhelmingly timing-dependent.
People uninformed of these serial herd behaviors are people fooled.
#8 Posted by Ed, CJR on Wed 6 Jan 2010 at 07:49 PM
In order to obtain real gains productivity must be increased. It has always amused me when people get raises. They totally neglect the rise in prices for which they are responsible. When we had an insular economy that worked out fairly well. Now that we are exposed to a world economy and people are willing to work for less than what we are used to making we suddenly have a crisis. Until we get our house in order by greater productivity and vastly lower taxes we will continue down the rain gutters.
#9 Posted by Bassboat, CJR on Wed 6 Jan 2010 at 08:46 PM
This article is unfair to stocks and to mathematics. For one, you cannot simply exclude dividends. Though smaller than they once were, they're still in the ballpark of 1.8% currently. Now add this to approximately 3.5% post-inflation return, and the real return is about 5.3% per year. But that's not the end of the story. If you started with $10,000 and compounded it at the post-inflation 5.3% per year for 30 years, you'd have $45,000 in TODAY's dollars, or about 4.5 the spending power you had when you started. Let's now assume inflation of 3.5% per year. So the nominal rate of return on your stocks goes up to 8.8% per year (which is close to what the nominal rate HAS been for 80+ years), and meanwhile, the cost of goods goes up by 3.5% per year. After 30 years, your $10,000 initial investment would be worth $115,000. Meanwhile, items that cost $10,000 back when you started investing now costs $27,000. So you've earned $88,000 ($115,000 - $27,000) AFTER inflation, or 8.8 times your initial investment in inflation-adjusted terms. This is about twice as good as the article implies. Yes, inflation is a bitch, but over long periods of time, stocks tend to beat inflation by a much wider margin than virtually any other asset class. Everyone feels pretty bad after the horrible decade that just finished, but it's wrong to falsely manipulate simple math and create a revisionish account of history simply because it fits the current mood of the nation.
#10 Posted by Jason, CJR on Wed 6 Jan 2010 at 10:45 PM
Jason,
I paraphrase what you wrote: I DON’T LIKE THAT, PLOT SOMETHING ELSE!!! Plotting price history is unfair only if it were called ‘total return’. The ‘average of everybody’ DJIA stocks-holder, whose experience one seeks to represent, took that whole ‘price ride’ -- dividends received and frictional costs paid out are his cash flow, separate from the price experience.
Real price histories are little-seen simply because they are not good advertising -- look here:
DOW: from WSJ 3/30/99 (page C14)
http://homepage.mac.com/ttsmyf/begun.pdf
HOMES: NYT 8/27/06 (section 4, page 1)
http://www.nytimes.com/imagepages/2006/08/26/weekinreview/27leon_graph2.html
In each, doesn't it look like topping out and falling far down is well-precedented? As in ‘not good advertising’! And the URL for up-to-date is:
http://homepage.mac.com/ttsmyf/RHandRD.html
The ca. 3.5 decade dominant periodicity seen in the Real Dow history is about an individual’s investment lifetime. What do you think of: “DON’T show that, just average through it!”. What I think: the vital question asked is “What is intellectual honesty’s cash flow?”.
#11 Posted by Ed, CJR on Wed 6 Jan 2010 at 11:55 PM
The premise of the story seems to be basically sensible.
It appears that to say that the inflation adjusted dow has only doubled in 80 years seems to be technically accurate, but a somwhat less pessimistic interpretation of the graph could be made. If the circa 1950 Dow were taken to to be the average of those years around 100 and the inflation adjusted dow taken to be what has been the average for the last decade of around 500, then the inflation adjusted dow has gone up by a factor of 5. When calculating the annual compounded return that shows a 2% return per year. The dow beat official inflation by 2% per year even making fairly optimistic interpreation of the data (assuming the inflation adjustment has been done accurately).
This is in the same order of magnitude as the after inflation return one might expect from interest bearing investments, but is probably a bit better than the interest. The (optimistic) 2% real return is even more probably less than the return from dividends for solid companies over those years. The combination of appreciation in equity plus dividends is where the real money is. It just goes to show that money is just a number and it's value is really what somebody will do for it.
The wall street boys to whom this is not news have devised for themselves a way to not have to worry about what the dow does.......just pay themselves plenty of shiny freshly created number money that can be laundered into the "real" money system. This is why we need strong, sensible regulation of the financial sector. We need to get rid of these illegitimate phoney "financial products". They are not products at all, just a way to make sure certain people get the money and the power. And the power part of that equation is why the regulation isn't happening.
It should be illegal for financial companies to issue large salaries and bonuses. Their incentive compensation should be in the form of stock only. That way, it other people who have money that has been generated from non-financial sources can pass judgement on how much real value has been created with the value of their stock. The effect of course, would be to kill off these "innovative instruments" because they simply wouldn't pay.
This whole house of cards depends on corruption.
#12 Posted by jake1492, CJR on Thu 7 Jan 2010 at 08:09 AM
jake1492,
FYI, here see the pasts shown, and called Serial Herd Behaviors:
http://homepage.mac.com/ttsmyf/RHandRD.html
Here see the 3 Fed Chair ‘warnings’:
http://homepage.mac.com/ttsmyf/3warnsRD.html
Realistically, we have had an ‘as was’ past, which was dominated by serial herd behaviors, little apparent to the public. So this is ‘as was behavior’. At best, any ‘rational/natural’ is obscured.
#13 Posted by Ed, CJR on Thu 7 Jan 2010 at 04:56 PM
Ed,
Sure, if you remove dividends you're technically correct that the average has not slam dunked inflation the way that investment company ads often portray, however dividends have accounted for a large percentage of the total return, and the majority of mutual fund investors reinvest their dividends, so why in the world would you exclude them? Only to present a biased view of stocks as an asset class. I guess the real question I ask: what asset class, which is passive and available to the general public, has had a better total return over the past 80 years? To exclude dividends is like looking at a rental property you own and calculating only the return on price without counting the rental income you received for decades. You'd only be looking at half the story. The only way to calculate if ANY investment was good or bad is to look at the TOTAL return, compare it to inflation and compare to other investments which were available.
Also, if the real return was in fact so miniscule, how is that my working-class parents invested a little bit of every paycheck in equity index funds for 30 years (while reinvesting dividends) and became multi-millionaires from that portfolio? They earned a decent living from working, but nothing most people would be jealous of. It's because the TOTAL RETURN of their investments is all the matters. In fact, many of their friends (who fell for scary articles with titilating facts along the way) are surprised and jealous that boring old buy-and-hold investing in a broadly diversified portfolio (not dotcom stocks or any other fad) actually produces very satisfactory returns over long periods of time as long as you don't jump on the bandwagon and unload during the inevitable down periods.
I share the view that investment bankers have raped our country for the last decade and probably earn way more than they should, but don't assault and asset class and basic mathematics. It'll only leave more people poor 30 years from now.
On a side note, I took a look at your first PDF and it's interesting. I'd be curious to see the rest of it if you don't mind posting. (I was only able to see the "Dow, Inflaction Adjusted" page, but not the pages above or below. Seems like a cool PDF. (I study these kind of charts for kicks.)
#14 Posted by Jason, CJR on Fri 8 Jan 2010 at 06:58 PM
Jason,
I write again what I wrote before, below.
But first, here is very compelling history that you would exclude from the people’s attention:
“the 3 Fed Chair warnings, Real DJIA” at
http://homepage.mac.com/ttsmyf/3warnsRD.html
I think this history is ‘serial herd behavior’ -- do you think so? The longtime status quo in our country is, fairly phrased, “the public be suckered”.
Jason,
I paraphrase what you wrote: I DON’T LIKE THAT, PLOT SOMETHING ELSE!!! Plotting price history is unfair only if it were called ‘total return’. The ‘average of everybody’ DJIA stocks-holder, whose experience one seeks to represent, took that whole ‘price ride’ -- dividends received and frictional costs paid out are his cash flow, separate from the price experience.
Real price histories are little-seen simply because they are not good advertising -- look here:
DOW: from WSJ 3/30/99 (page C14)
http://homepage.mac.com/ttsmyf/begun.pdf
HOMES: NYT 8/27/06 (section 4, page 1)
http://www.nytimes.com/imagepages/2006/08/26/weekinreview/27leon_graph2.html
In each, doesn't it look like topping out and falling far down is well-precedented? As in ‘not good advertising’! And the URL for up-to-date is:
http://homepage.mac.com/ttsmyf/RHandRD.html
The ca. 3.5 decade dominant periodicity seen in the Real Dow history is about an individual’s investment lifetime. What do you think of: “DON’T show that, just average through it!”. What I think: the vital question asked is “What is intellectual honesty’s cash flow?”.
#15 Posted by Ed, CJR on Sun 10 Jan 2010 at 07:25 PM
Shouldn't taxes be also included for taxable accounts which the bulk of accounts fall into. I note that the average holding is about 2-3 years, so that means a whack of the inflation is paid as taxes and a whack of the real gain is held back with less capital to reinvest.
#16 Posted by Mike, CJR on Sun 7 Feb 2010 at 09:38 PM
Mike,
(The ttsmyf URLs are mine.) I've not even thought about reckoning taxes, because their effect, while always subtractive, varies so very much with personal circumstances -- so, DIY.
If people would just reckon 'real', rather than 'nominal', it would be a very large advance.
#17 Posted by Ed, CJR on Mon 8 Feb 2010 at 02:02 PM
What if the stock charts had to include stocks such as Enron and Lehman Brothers for a period of say 20 years past the date of bankruptcy? What would the charts look like then? Aren't the charts peddling false optimism by kicking the the dead out of the lifeboat?
#18 Posted by Pete, CJR on Fri 16 Jul 2010 at 11:39 AM
That's a good point, Pete. Especially with the Dow. Anybody seen an analysis of this?
#19 Posted by Ryan Chittum, CJR on Fri 16 Jul 2010 at 01:28 PM
Pete, Ryan,
I did NOT just look this up, but this is my understanding for the Dow. When a component substitution is made ('promising' replacing 'dying' -- or any other), the Dow does not change -- they change the divisor number to effect no change. Subsequently, of course, 'promising' can soar, but so can 'dying' if recovery occurs -- and the opposite can happen for either/both.
#20 Posted by Ed, CJR on Wed 21 Jul 2010 at 01:55 PM
Simple explanation. In 1963 Joe put $100,000 in US silver coins in his bank deposit box. Fred put $100,000 in paper money in his bank box. In 2011 they took the money out.
Joe's silver coins were worth $2,800,000 in fake pretend Federal Reserve notes and bought 700,000 gallons of gasoline.
Freds paper money bought 25,000 gallons of gasoline. Which would you rather have, 25,000 gallons of gasoline or 700,000 gallons of gasoline? This is called currency debasement or inflation. When stocks are printed it is called dilution. It's all the same thing caused by the US Federal Reserve Bank charter.
The Dow is lower today than it was in 1963 in real 1963 US silver money. It's just currency debasement. How are we going to pay that $14 Trillion debt?
#21 Posted by jack goldman, CJR on Wed 13 Apr 2011 at 12:31 AM