Sign up for the daily CJR newsletter.
The Wall Street Journal has a poor story today reporting that “High-Earning Households Pay Growing Share of Taxes.”
The paper’s editorial page has long pushed this issue, notoriously referring to folks who pay no income taxes as “lucky duckies.” You know, lucky enough to be so poor that they don’t have to pay taxes. At least we got a comic strip out of that:

The Journal‘s story would have you believe that the rich are shouldering almost all of the tax burden. But the federal income tax is just part of the overall tax burden, and the paper barely mentions that fact, while it conflates income taxes and overall federal taxes.
Here’s the lede:
As President Barack Obama pushes to raise income taxes on high earners, opponents are seizing on data that indicates these U.S. households already pay a large and growing share of taxes, even compared with high-tax European countries. And a new congressional study concludes that the percentage of U.S. households owing no federal income tax climbed to 51% for 2009.
It focuses on overall taxes in the first sentence and income taxes in the second. But even those in the poorest quintile pay payroll and excise taxes (and a net effective federal rate of 4 percent). When it “to be sures” that a few paragraphs down, the Journal makes it a “Democrats said” thing rather than a plain fact and the paper gives no numbers to back it up.
Senator Orrin Hatch sets the tone for the story, getting the third paragraph to himself:
“Most taxpayers are skeptical that the answer to our fiscal problems is for them to sacrifice more, when more than half of all households are not paying any income taxes and an increasingly smaller group of Americans is shouldering the burdens for an increasing larger group of Americans,” said Sen. Orrin Hatch of Utah, the top Republican on the Senate Finance Committee.
Which is followed by the to-be-sure graph that doesn’t cut it:
For their part, Democrats note that the incomes of higher earners have been growing far more rapidly, so it’s only natural that they would pay a higher share of tax. As for those Americans who pay no federal income tax, most of them still pay Social Security and Medicare payroll taxes that can take a significant share of their income, Democrats said.
The paper tosses that off but gives us no numbers on what the net federal tax burden for those lucky duckies in the 51 percent of folks not owing income tax. It’s an average 4 percent for the bottom quintile, 11 percent for those in the second, and 14 percent for those in the third.
Then there’s this:
A 2008 study by the Organization for Economic Cooperation and Development, for example, found that the highest-earning 10% of the U.S. population paid the largest share among 24 countries examined, even after adjusting for their relatively higher incomes. “Taxation is most progressively distributed in the United States,” the OECD study concluded.
It’s interesting that the paper flagged a three-year-old study. Where have I seen that quote before? Ah, yes. The Wall Street Journal editorial pages, cherry picking from an OECD report on how poverty and inequality is growing in OECD countries, particularly in the United States, whose poorest are quite a bit poorer than those of the average developed country. I’ll quote the OECD:
The United States is the country with the highest inequality level and poverty rate across the OECD, Mexico and Turkey excepted. Since 2000, income inequality has increased rapidly, continuing a long-term trend that goes back to the 1970s.
Rich households in America have been leaving both middle and poorer income groups behind. This has happened in many countries, but nowhere has this trend been so stark as in the United States. The average income of the richest 10% is US$93,000 US$ in purchasing power parities, the highest level in the OECD. However, the poorest 10% of the US citizens have an income of US$5,800 US$ per year – about 20% lower than the average for OECD countries.
Here’s another OECD quote that didn’t make it:
Tax-and-benefit systems are also redistributive in Korea and the United States, but to a much lesser degree
And this quote from the OECD paper means the Journal‘s assertion that the rich in the U.S. pay the most of any country studied “even after adjusting for their relatively higher incomes” is not quite true (emphasis mine):
Based on the concentration coefficient of household taxes, the United States has the most progressive tax system and collect the largest share of taxes from the richest 10% of the population. However, the richest decile in the United States has one of the highest shares of market income of any OECD country. After standardising for this underlying inequality, Ireland has the most progressive tax system as measured by the ratio of the concentration coefficients of household taxes and market income, while Australia and the United States collect the most tax from people in the top decile relative to the share of market income they earn.
Moreover, I have to question whether the OECD study is valid at all. It uses something called “household taxes,” but the numbers don’t seem to add up. The data it uses says that average household taxes in the U.S. during the “mid-2000s” were higher than they were in the UK and the same as France and Canada, at about 26 percent of income. I don’t think so.
Here’s another OECD report on taxes as a percentage of GDP. It has 2009 U.S. numbers at 24 percent of GDP, while Canada is 31 percent, the UK is 34 percent, and France is 42 percent. For all levels, including state and local, U.S. tax revenue was at 32 percent of GDP in 2008, while Canada was at 40 percent, the UK at 42 percent, and France at 49 percent. Those numbers include corporate taxes, but those are lower in the U.S. as a share of GDP than in other similar countries.
Meantime, there’s this from the Journal today:
They say it’s more important to look at the tax rates being paid by higher earners. In the U.S., the average tax rate for higher earners has fluctuated, but generally has declined for the top 10% from 29.6% in 1979, to 26.7% in 2007, according to the CBO, even as incomes for that group were rising.
That’s misleading. The Journal has been talking about federal income taxes up to now, but this CBO number includes all federal taxes, including payroll. The top 10 percent paid nowhere near a 26.7 percent federal income-tax rate in 2007. That number, according to the same CBO estimates, was 16.2 percent, and it was 18.8 percent, according to the IRS (spreadsheet), which oughta know.
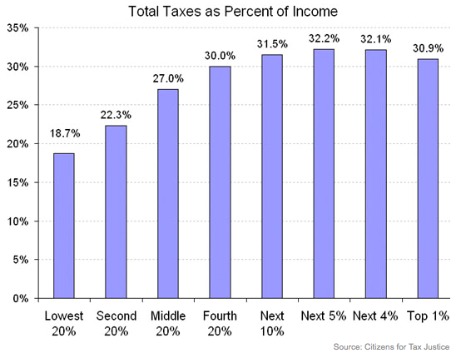
If you want a real look at who pays taxes in the U.S., you have to include payroll and excise taxes for everybody, as well as state and local taxes, which are highly regressive:
Another problem here is that the Journal focuses variously on the top 10 percent or the top 20 percent of earners. But the income gains haven’t been concentrated in the 80th to 98th percentiles. They’ve been concentrated in the 99th percentile, and more specifically in the 99.9th percentile.
And the Journal‘s graphic arbitrarily looks at the numbers only since 1987, rather than, say, 1979, before top tax rates were slashed by Reagan.
The story here that the Journal misses is that effective federal tax rates for the top 1 percent have plunged over the last three four or five decades while those of the top 20 percent and the second-highest quintile, which obviously includes the top 1 percent, have risen. In other words, the 60th to 99th percentile are paying a lot more while the richest pay a lot less.*
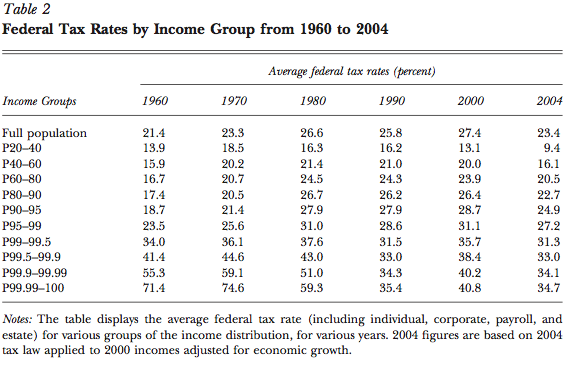
If you go back half a century, the picture is even more striking: Middle-class tax rates have risen or stayed the same while those of the top 1 percent, and especially the top 0.1 percent’s, have plummeted.
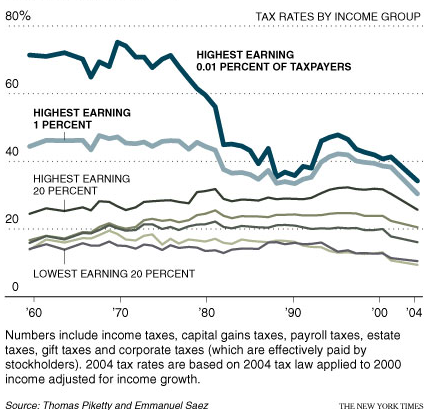
As David Leonhardt said about that chart:
If we had good numbers on the distribution of state and local taxes, the picture would be even more pronounced. These taxes tend to be less progressive than federal taxes…
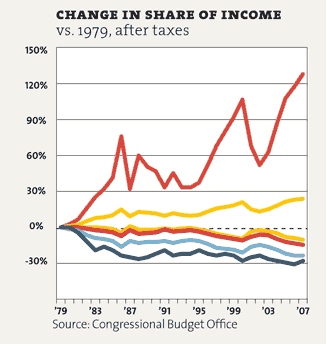
The Journal does note that at least part of the highest quintile’s greater share of the overall tax burden is due to their income gains, but it obscures the inequality again by not focusing on the top 1 percent, which has gotten almost all of the after-tax income gains of the last three decades (the red line here is the top 1 percent and the yellow line is the top 20 percent):
The paper goes on to call Singapore an “emerging economy.” Presumably, having per capita GDP (in purchasing power parity) that’s 10 percent to 20 percent higher than the U.S. means you’ve emerged.
This story’s meme emerged from the Journal edit page. Best to stick it back in that cesspool.
* I updated this paragraph to add a chart and to include the fourth quintile in those who’ve had their tax rates raised.
UPDATE: Felix Salmon, who’s a contributing editor here, also had a harsh take on this piece. Read it over at Reuters.
Has America ever needed a media defender more than now? Help us by joining CJR today.