Sign up for the daily CJR newsletter.
Every year, news stories about US gasoline prices appear in the early spring and remain popular until the end of the summer driving season in September. But “pain at the pump” takes on special significance during presidential election years, as Republicans and Democrats use gas prices to attack one another’s energy policies and curry favor with voters. This year, the GOP is blaming the Obama administration for rising prices, but in 2008, it was Barack Obama, then a senator from Illinois, who was pointing his finger at Washington. Make no mistake, all such accusations rest on shaky ground. The price of gasoline is determined primarily by the price of crude oil (in February it accounted for 72 percent of the cost of regular unleaded and 65 percent of the cost of diesel), which is established by a global market over which US energy policy holds little short-term sway.
The 2012 campaign has already seen innumerable claims and counterclaims related to gas prices and domestic oil production. Journalists should be fact checking all those statements, letting their readers and viewers know whether they represent truth or spin. More often than not, however, they drop competing quotes into their stories without assessing their relative merits. This is lazy reporting that does a disservice to voters. We understand it can be hard to dig up the necessary background on deadline, especially while traveling. Here, then, is a Reporter’s Toolbox of primary sources of information related to gasoline prices and oil production in the US, which journalists can use to evaluate and clarify the political rhetoric.
Gasoline Prices
The US Energy Information Administration (EIA) maintains a terrific website called Energy Explained, which provides easy to understand explanations of all of the country’s renewable and nonrenewable energy sources. The section on Gasoline is broken down into five subsections: Where Our Gasoline Comes From, Use of Gasoline, Prices and Outlook, History of Gasoline, and Gasoline & the Environment. The Prices and Outlook subsection is further divided into three parts, which campaign reporters will likely find most useful:
- • Factors Affecting Gasoline Prices: the cost of crude oil; taxes; refining costs and profits; distribution and marketing costs and profits.
- • Price Fluctuations: crude oil supply and prices; seasonal demand for gasoline.
- • Regional Price Differences: distance from supply; supply disruptions; retail competition and operating costs; environmental programs.
The EIA also maintains a useful Frequently Asked Questions (FAQ) page covering all energy sources and prices. The Gasoline heading includes answers to queries such as:
- • What’s up (and down) with gasoline prices?
- • Why don’t fuel prices change as quickly as crude oil prices?
- • What do I pay for in a gallon of regular gasoline?
- • Does EIA have gasoline prices by city, county, or zip code?
- • How can I find historical gasoline prices for each State?
- • Where can I find inflation-adjusted gasoline prices?
- • What is the outlook for gasoline prices for 2012 and for 2013?
Those wanting to dig deeper should turn to the EIA’s Petroleum & Others Liquids website. It includes the weekly Gasoline and Diesel Fuel Update and is denser than the overview/explainer pages, but contains hard data and analyses and projections for prices, crude reserves and production, refining and processing, imports/exports and movements, stocks, and consumption and sales. One of the more useful resources to be found there is the report This Week in Petroleum, which provides information about recent events affecting the petroleum industry and markets.
The Global Oil Market
Since the price of crude oil is the primary determinant of the cost of gasoline, it behooves reporters to know something about the global oil market. A good place to start is the EIA’s primer on Oil Market Basics, which includes chapters on supply, demand, trade, refining, stocks, and prices, among others. The administration also has a helpful page, “What Drives Crude Oil Prices?”, which is updated monthly and quarterly, and which analyzes seven factors that influence oil markets: supply from OPEC and non-OPEC countries (Organization of Petroleum Exporting Countries), demand in OECD and non-OECD countries (Organization for Economic Cooperation and Development), inventories and reserves, spot prices, and financial markets.
From there, the EIA provides up-to-date statistics on international oil production, consumption, and pricing (including historical and projected information), as does the International Energy Agency (IEA) via its monthly Oil Market Report.
US Oil Production
The Obama administration has countered accusations that it is responsible for rising gas prices by pointing out that US oil production has been climbing for the last three years after falling every year from 1991 through 2008; that crude oil imports have fallen to their lowest level since 1999; and that in 2011, the US was a net exporter of refined petroleum products for the first time since 1949.
All of that is true, but critics have parried those points by arguing that the Clinton and Bush administrations deserve credit for the leasing and permitting that created those conditions, and that recent growth in production has occurred on private rather than public land. They are valid points, but the conclusion that critics draw from them—that production has climbed in spite of Obama’s restrictive policies—is debatable. Unfortunately, the data that journalists need to inform that debate is rather opaque.
The EIA keeps a handy database of total crude oil production in the US going back to 1859, but nowhere online does the government publish a single, straightforward set of statistics about how much of that production is occurring on federal lands and waters. Worse still, in 2010, the Government Accountability Office (GAO) issued a report to Congress, which stated, “[The Dept. of the] Interior’s measurement regulations and policies do not provide reasonable assurance that oil and gas are accurately measured.”
After the EIA issued its Annual Energy Review report for 2010 in October, Rep. Ed Markey of Massachusetts, the top Democrat on the House Natural Resources Committee, sent a letter to the EIA criticizing its accounting methods for oil and gas production of federal and Indian lands. The congressman pointed out that EIA figures were based on sales volumes rather than actual production volumes. As a result, the EIA counted only oil produced from federal lands for which royalties were paid to the federal government, neglecting volumes for which no royalties were paid as well as volumes transferred to the country’s Strategic Petroleum Reserve. As a result, the EIA updated its numbers and issued a special appendix on March 15, which explained its methods and emphasized that all its data regarding fossil fuel sales came from the Department of the Interior.
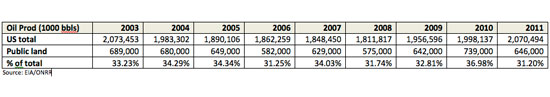
Production data for federal lands and waters can be found at the Office of Natural Resources Revenue, whose figures are based on industry-reported sales volumes and royalty payments rather than actual production volumes. Data for different years, as well as royalty-revenue and non-revenue volumes, are all on different pages, though, so it takes a spreadsheet and a little bit of arithmetic to map out long-term trends. The EIA did the math in order to update its Annual Energy Review following Markey’s letter. The data in the report, which go back to 2003, show that there was indeed a large decline in oil production on federal lands and waters in 2011. But that observation belies the fact that federal lands and waters were exceptionally productive during 2010, outstripping any year’s productivity during the Bush administration. Indeed, the average productivity on federal land and waters during the four Bush years, 2003-2008, was 634 million barrels per year. During the three Obama years, 2009-2011, it was 676 million barrels. During the Bush years, federal lands produced roughly 33 percent of the national output on average. During the Obama years, they produced roughly 34 percent:
Critics might still argue that the production during the last few years was dialed in during the Clinton and Bush administrations, so it’s also worth looking at Interior’s leasing and permitting statistics. The Bureau of Land Management (BLM) keeps both numbers for onshore activities. For offshore activities, the Bureau of Ocean Energy Management (BOEM) keeps leasing stats and the Bureau of Safety and Environmental Enforcement (BSEE) keeps permitting stats.
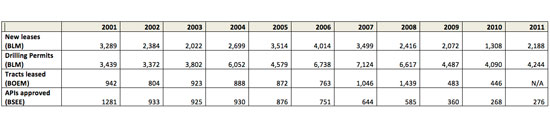
BLM’s database is pretty clear-cut, but figuring out what’s been happening offshore requires another spreadsheet and more arithmetic. The data show that between 2001-2008, BLM issued 2,980 new leases and 5,215 drilling permits per year on average, while the Minerals Management Service (the precursor to BOEM and BSEE) leased 960 new tracts of land and issued 866 drilling permits per year on average. By comparison, during the Obama years, BLM issued only 1,856 new leases and 4,274 drilling permits per year on average, while BOEM issued only 465 new leases and BSEE issued only 301 drilling permits per year on average:
The apparent decline in leasing under the current administration may be somewhat illusory given the relatively short period of time that Obama has been in office. As the EIA noted in the Annual Energy Review, “Crude oil production from Federal lands is dominated by offshore production from the Federal Outer Continental Shelf (OCS),” and the recent decline is a result of the timing of several major projects, weather-related damages and disruptions, and the government actions taken in the wake of the Deepwater Horizon disaster in the Gulf of Mexico, where most offshore activity takes place.
Despite a slower permitting process and increased environmental review since the Gulf of Mexico oil spill, the EIA’s Annual Energy Outlook 2012 Early Release projects that deepwater oil production in the Gulf of Mexico, as well onshore shale oil production, will drive increases domestic production over the next ten years. In November, the Department of the Interior announced its proposed 2012-2017 Outer Continental Shelf Oil and Gas Leasing Program, which makes more than 75 percent of estimated undiscovered technically recoverable oil and gas resources on the OCS available for exploration and development. In December, Interior held the first oil and gas lease sale in the Gulf of Mexico since the Deepwater Horizon explosion and oil spill, covering more than 21 million acres. It will hold its next lease sale, covering nearly 38 million acres, on June 20.
US Energy Policy
According to the EIA, the US was the world’s third largest oil producer in 2010, behind Saudi Arabia and Russia, and has, for the last five years, provided roughly 10 to 11 percent of global supply. But even relatively small increases or decreases in US production take time and may not significantly impact the price of oil. A report from the Congressional Research Service released on March 1 stated:
A key issue affecting crude oil prices in recent months has been uncertainties around supply stemming from tensions with Iran as new U.S. and EU sanctions come into place. Unrest in several small oil producers has also led to supply disruptions. Also, there are persistent concerns about the adequacy of global supply in the face of sustained demand growth in emerging economies. Recent refinery closures in the United States, Europe, and elsewhere may also contribute to higher gasoline prices, particularly in parts of the East Coast.
The EIA recently affirmed that view in a February report, noting that “global liquid fuels consumption is at historically high levels.” With respect to supply, it continued:
… the world has experienced a number of supply interruptions in the last two months, including production drops in South Sudan, Syria, Yemen, and the North Sea. Both the United States and the European Union (EU) have acted to tighten sanctions against Iran, including measures with both immediate and future effective dates.
Finally, spare crude oil production capacity, while estimated to be higher than during the 2003 to 2008 period, is quite modest by historical standards, especially when measured as a percentage of global oil production and considered in the context of current geopolitical uncertainties, including, but not limited to, the situation in Iran.
Where US supply and demand is concerned, the Congressional Research Service emphasized that:
Many of the policies that may address rising gasoline prices are long term. Investments that produce or consume oil, such as new oil fields, pipelines, cars, or factories, are capital intensive and long term in nature. There are limited short term options available to policy makers to address gasoline price increases.
Helpfully, the report went on to analyze the limited efficacy of several short-term options that have been considered by policymakers, including:
- • Releasing oil from the Strategic Petroleum Reserve Release
- • Instituting a gasoline tax holiday
- • Relaxing fuel specifications
- • Restricting tefined products exports
- • Limiting financial speculation
- • Pursuing diplomatic measures
Beyond these supply-side considerations, environmentalists point out that demand-side strategies, including measures that reduce driving and/or increase fuel efficiency, can be effective. Along those lines, the Department of Energy and the Environmental Protection Agency maintain a useful website, www.fueleconomy.gov, which includes a page on gasoline prices. Indeed, given that the U.S. produces about 11 percent of the world’s annual oil supply on average, and accounts for about 23 percent of its annual consumption, reducing demand might be the quickest and most effective way to relieve pain at the pump.
Has America ever needed a media defender more than now? Help us by joining CJR today.