
Sign up for the daily CJR newsletter.
For those of us of a certain small-but-growing subset—the blogging, commenting, techno-savvy, early-adopting, extreme-news consumers—it’s sometimes easy to forget that most people don’t live like we do. They don’t use RSS. They don’t Twitter. They don’t read twenty blogs a day. They (some 100 million or so) still actually pick up the newspaper and read it.
Martin Langeveld published a fascinating analysis a few months ago on how much reading of a newspaper is done online versus in print and came up with a shocking estimate: 96.5 percent print, 3.5 percent online.
Seeing Editor & Publisher‘s monthly Nielsen story on time spent on the top newspaper Web sites got me to thinking there’s another way to get at this metric. If you take the average time spent per user per month for a site and multiply that by the number of unique visitors, you come up with a rough estimate of how much total time is spent on a site in a month— a number that seems pretty important if you want to sell attention, as they say.
I came up with several scenarios using the top five newspaper sites and found that the highest proportion of time spent reading their content online was 17.6 percent and the lowest just 8.3 percent.* And you wonder why publishers are still so concerned about their print products.
E&P reported the other day that The New York Times, for instance, had 17.4 million visitors to its Web site in June. It reported yesterday that the average visitor spent 14 minutes and 29 seconds on the site that month (this appears to be an anomaly. That Times stat is usually about twice that).
That means that readers collectively spent about 4.2 million hours on the Times site in June.
The second biggest newspaper site, the Los Angeles Times, had 10.3 million visitors in June who spent an average 10 minutes and 53 seconds there. That works out to 1.9 million hours spent on latimes.com in the month.
So how does that compare to time spent reading the paper? The New York Times has 1.1 million subscribers (I averaged in Sunday circulation, which is higher than daily) who the company says spend more than thirty minutes a day with the paper. That’s 16.5 million hours per month, nearly four times the total time spent on New York Times Online.
But even this huge disparity underplays the print advantage. The Newspaper Association of America says each copy is read by 2.2 people a day (again, I averaged in Sunday to come up with that figure).
Now the NAA’s a trade group with an interest in high numbers, so let’s be conservative and say it’s being optimistic by half and that 1.6 people read each copy per day. That brings the total time spent with the print NYT to 26.4 million hours.
New York Times Media Group brought in $1.08 billion in advertising last year. Of that, I’ve estimated about $150 million last year came from online ads. That would mean nearly $860 million came from print advertising. The print-to-online-ad ratio is 5.7 to one.
That lines up pretty well with the ratio of time spent with the paper versus online, which is 6.3 to one, using the readership numbers. That’s surprising to me, because from everything I know, print ads have much more impact than those on newspaper Web sites.
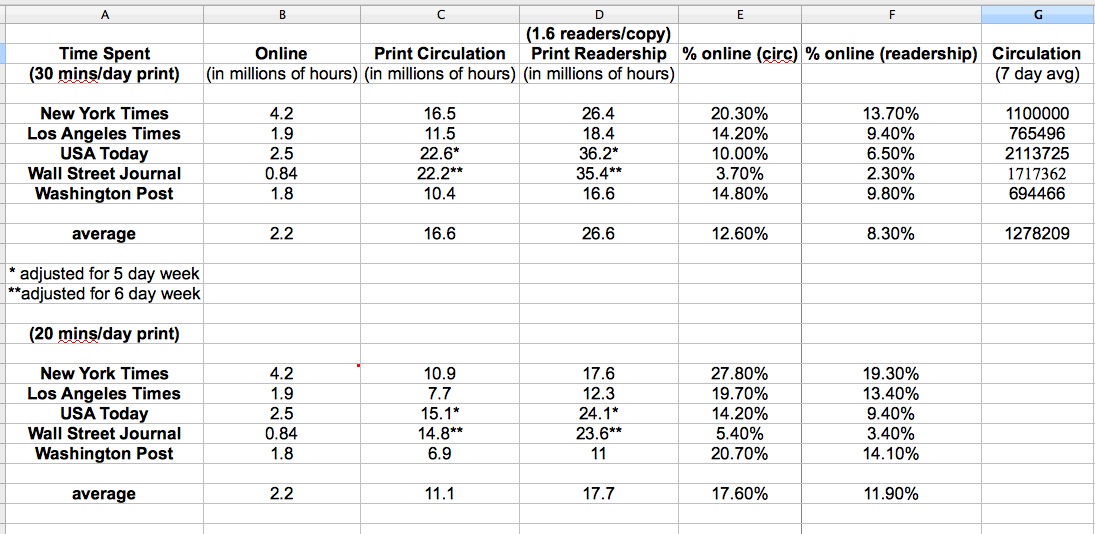
I ran the numbers for the top five newspaper websites in the country and put together a chart with the information for each. Note that the disparity between print and online time spent is even greater than it is at The New York Times.
In the top part of the chart I used the thirty-minute per reader per day assumption for print. To satisfy those who will surely bellow that’s too high, I did another chart using twenty minutes per reader per day.
Now this is a blunt instrument for estimating this stuff—some papers are going to be read by more people per copy than others. Some papers will have more time spent per reader per copy than others. But this is the data we’ve got.
My take on this is that this analysis shows that publishers aren’t exactly fools to not throw everything into online. Print is where the eyeballs are; it’s where their best customers are.
Of the top five newspaper websites the average reading time online is 12.6 percent to print’s 87.4 percent. That widens to 8.3 percent online, 91.7 percent print when considering that more than one person reads each print copy.*
Advertisers like readers who pay to subscribe more than they do those who don’t, which benefits print. That’s counterbalanced by the fact that online readership presumably skews younger, more educated, higher income, which itself points to a major problem for newspapers.
At the same time, it shows the downside of a paywall strategy like that of The Wall Street Journal. Its online reading is miniscule compared to papers with free sites. Of course, the Journal does have that nifty $60 million or $70 million in subscription revenue to ease the pain.
This analysis doesn’t take into account the fact that once readers go online, they start getting their news from other sources, like blogs, aggregators, and, say, MSNBC.com. Clearly newspapers are missing a ton of traffic and attention time. It also doesn’t take into account the impossible-to-quantify amount of time spent reading newspapers’ remixed content on those same places, which anyway doesn’t much matter to newspapers if they can’t monetize it.
Also these online numbers are volatile from month to month. For example, if I had used The New York Times’s time spent online from May (which was twice the June time for some reason), its total hours would have been 8.4 million. Some numbers don’t pass the smell test, like The Wall Street Journal content being read online just 3.7 percent. That is probably from the weakness of the Internet data. I find it hard to believe that average time spent on The Boston Globe’s site, for example, soared 300 percent from May to June.
But the bottom line is, using this method of getting at print versus online reading time, the numbers, while not as shocking as Langeveld’s estimates, are still disproportionately stacked toward print. They support his point. This, despite the fact that publishers have incentivized their print customers to become online ones.
This analysis doesn’t present any trendlines, which are moving away from print and toward online. But this is fifteen years into the age of the online newspaper—and going on a decade into the high-speed Internet era—and you can spin it a couple of ways: It points to the surprising resiliency of print, or it signals the pitiful job newspapers have done online.
I’d say it’s some of both.
UPDATE:
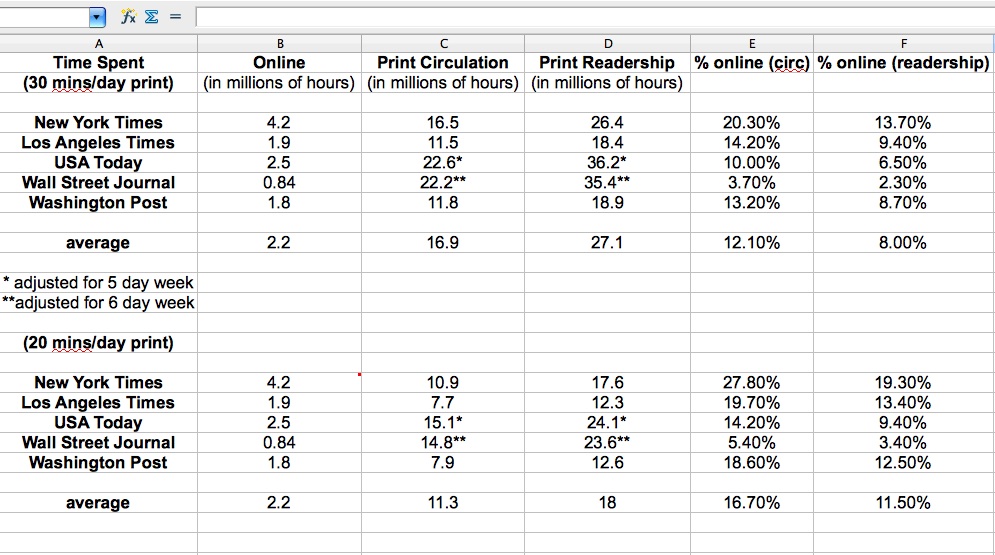
* I’ve updated the chart to fix an out-of-date circulation number I used for the Washington Post. Using the correct number makes the WaPo’s online-to-print ratio slightly more favorable to online and has tiny impacts on the averages for the five, which I’ve also corrected—as signaled by an asterisk. I’ve also included the circulation numbers I used to calculate print reading time. I averaged in Sunday circulation to get a seven-day average.
You can see the original, uncorrected chart here.
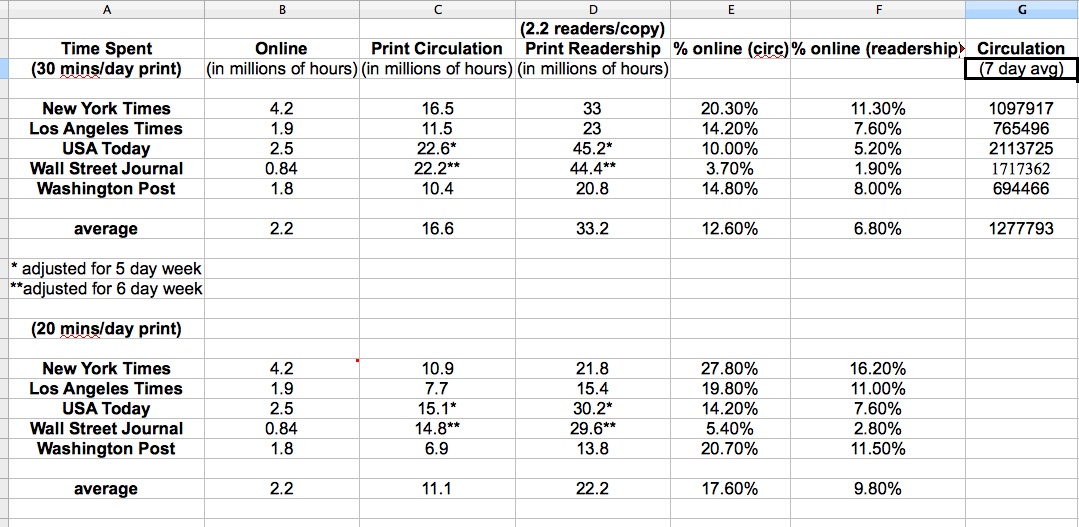
John Mecklin, in comments below, questions why I didn’t use NAA readership numbers. I used 1.6 readers per copy to be conservative, as I explained in the post. But he has a point, so I ran the numbers using the NAA’s 2.2 readers per copy figure. See below:
Has America ever needed a media defender more than now? Help us by joining CJR today.


