

Sign up for the daily CJR newsletter.
View interactive version here.
Executive summary
When local news mapping gained prominence a decade ago, the widespread concern was with news deserts. Now that local news—from journalism outlets, civic information providers, or independent newsfluencers—is available via social media, newsletters, YouTube, and elsewhere, people are more likely to feel adrift in information oceans. This paradigm shift requires us to reinvent our understanding of local news provision.
At the same time, the advent of artificial intelligence and advanced computational tools has allowed local news mapping to make giant leaps forward. Research can now go beyond the traditional local news outlet census to analyze content for both breadth of topics covered and detailed geographic coverage areas—down to the census-tract level.
In addition, it has become clear that people no longer rely on local journalism outlets alone (where they exist) for important local news and information. Accordingly, we broaden the scope of “who counts” as a local civic information provider to include civil society organizations—schools, houses of worship, municipalities, nonprofits—that are vital and trusted interlocutors at the local level.
This report provides a proof of concept, using Charlotte, North Carolina, as a test case, for both AI-driven methods for mapping news and the paradigm shift toward greater inclusivity. We found that Charlotte has myriad local news and information providers that span topics, neighborhoods, and platforms, and we used our newly developed tools to gain visibility into how specific segments of local news providers add value, and where conditions can be improved. We conclude with recommendations for Charlotte’s local news funders and publishers and for improvements to our research program going forward.
Topline findings
- Charlotte is served by more than sixty local news providers, on a range of media and platforms, that cover a breadth of local-interest topics. Several niche providers cover topics not covered by anyone else in the local ecosystem. We visualize this using our semantic map.
- The amount of coverage varies significantly by neighborhood, with Center City and other areas that are home to large event venues, hospitals, and the airport receiving a disproportionate amount of coverage while many other parts of the city receive very little.
- When the least-covered neighborhoods are mentioned in local news, it is often in the context of crime stories.
- Related, we found that crime and entertainment coverage vary predictably with the proportion of Black and white residents; neighborhoods with a higher proportion of Black residents are more likely to be covered in the context of crime, while neighborhoods with a higher proportion of white residents are more likely to be covered in the context of entertainment stories.
- We analyzed the digital communications of more than five hundred Charlotte-serving civil society organizations (CSOs) to understand whether they are meeting local information needs in a way that supplements or fills in for missing local news. We found that CSOs are covering some topics—especially in schools and public institutions, such as firehouses—that local news outlets are not, suggesting opportunities for collaboration or content sharing.
- Most Charlotte CSOs are very active on social media, with more than 80 percent of our sample using three or more platforms to reach their constituents. The most common platforms are Facebook and Instagram; 60 percent have email newsletters.
- Overall, our mix of organizations was top-heavy with local news outlets, which limited the extent to which we could compare CSO coverage with local news. As a result, we learned valuable lessons that can be applied to future iterations of this method.
Introduction
Popular Instagram handle CLT Guide has gained 100,000 new followers in the past 6 months.
“I’ve received 3 offers to buy the media company in the past 2 months,” [founder] Jesse [Kremer] told me. “But I have absolutely zero interest in selling.” It’s profitable and doing “mid 6-figures” in revenue with just 2 full-time employees. Jesse makes his revenue selling $75–$600 paid post deals.
Tiny take: It’s not all doom and gloom in local media! But damn, it looks different—you’ve got a former poker player with arguably more power than the front page of The Charlotte Observer. —tiny money newsletter, 8/7/25
Though local news mapping is not new, there are three novel aspects of our effort to map the local news and information landscape of Charlotte, North Carolina. First, very few studies have mapped a single city’s local news landscape, which presents different challenges from mapping larger geographic units of analysis1[1] But see A. Lindgren, “News, Geography, and Disadvantage: Mapping Newspaper Coverage of High-Needs Neighbourhoods in Toronto, Canada,” Canadian Journal of Urban Research, 18/1, Summer 2009, pp. 74–97. Accessed at jstor.org/stable/26193230; S. Solomon and A. Hart, “The Shape of Chicago’s Media Ecosystem and Possible Paths Forward,” Democracy Fund, June 2018. Accessed at localnewslab.org/wp-content/uploads/2019/05/Democracy-Fund_Chicago-Media-Ecosystem_final.pdf; “Mapping NYC Community Media,” Center for Community Media, July 28, 2021. Accessed at journalism.cuny.edu/2021/07/mapping-nyc-community-media. Second, we employed new programmatic methods to analyze the content produced by Charlotte organizations, providing greater visibility into communities and topics covered. Third, we included local news delivered by podcast, newsletter, and other formats not considered by previous mapping studies, as well as news from civil society organizations such as schools, libraries, and nonprofits, broadening the lens of “what counts” as local civic news.
We developed this new methodological approach because we saw that current mapping methods were not capturing the breadth of local news now on offer, nor were they leveraging the advances offered by artificial intelligence. Our methods bring a degree of nuance and precision that allows funders, policymakers, and local news providers to make the most efficient use of available resources.
Research has shown that the availability of quality local news and information is inextricably linked to the health of local communities2[2] E.g., Napoli, “Cities Benefit from Local Journalism. They should do more to support it,” German Marshall Fund of the United States, April 10, 2024. Accessed at gmfus.org/news/cities-benefit-local-journalism, and, conversely, that not having quality local news yields a host of negative consequences.3[3] E.g., Ma et al., “Local newspaper closures and bank loan contracts,” 2025, accessed at onlinelibrary.wiley.com/doi/10.1111/1911-3846.13046 But without detailed knowledge of local news and information landscapes, interventions by funders and journalism support organizations are less effective. Two macro factors—major disruptions to the local journalism business model over the past decade-plus, and the growth of journalism support and philanthropy—have resulted in a burgeoning subfield of local journalism mapping, which has sought to provide this detailed knowledge.4[4] See, e.g., “Understanding Local News and Information Ecosystems,” Local News Impact Consortium, n.d.
The practice of mapping news providers has grown up alongside the concept of the news desert, a term denoting a geography that is not covered by news. The term was coined around 2011 to describe a town that had lost its local newspaper.5[5] See also P.M. Abernathy, “The Expanding News Desert,” UNC Center for Innovation and Sustainability in Local Media, 2018. Accessed at cislm.org/wp-content/uploads/2018/10/The-Expanding-News-Desert-10_14-Web.pdf Although the concept of a news desert has rightly generated many studies and commanded industry and academic attention, it has begun to feel dated. While communities not covered by local news outlets are surely at a disadvantage, neighbors and local organizations have adapted by finding new ways to produce and share news and information—whether via a Facebook group, the Nextdoor app, or a WhatsApp chat. In a 2022 survey, approximately half the residents of areas designated as news deserts disagreed with this characterization, saying they could find the information they needed about their communities.6[6] J.R. Collier and E. Graham, “Even in ‘news deserts,’ people still get news,” Center for Media Engagement, 2022. Accessed at mediaengagement.org/research/people-still-get-news-in-news-deserts/ Local news mapping must evolve to account for these newer methods and platforms.
Part of that evolution has to do with the methodology behind mapping local news ecosystems. Most mapping studies are based on a census of news outlets, which pinpoints an organization on a map (or, more accurately, assigns it to the administrative unit, such as a county, in which it sits). Counties that are not home to a local news organization are assumed to be news deserts.
But there is another way to map news: by geographic coverage area. Rather than assigning a news outlet to the town or county in which it is physically located, mapping by coverage area assigns a news outlet to the multiple towns or counties it covers. Assigning a local news outlet to the single town where its newsroom is located—even if it also covers adjacent towns—means those adjacent towns are designated as news deserts. This leads to an undercounting of coverage, while simultaneously overstating the number of news deserts. Yet very few mapping studies map outlets by coverage area; the main reason for this is that it is far easier to find a news outlet’s physical address than to catalogue the towns or areas it covers. In addition, more and more local news outlets are staffed entirely remotely, making it impossible to map many newsrooms’ physical locations.
Indeed, one of the primary methodological distinctions among mapping studies is between mapping by a news outlet’s location and mapping by its coverage area. Choosing one method over the other has important implications for data gathering, findings, and the arguments one can make based on those findings. Each method has benefits and drawbacks, primarily related to the time and resources needed to conduct the research. In short, mapping by coverage area has heretofore been more time-intensive because those data must be gathered manually using outlets’ self-proclaimed coverage areas, which are reported idiosyncratically, or by manually tagging locations mentioned in stories.
Charlotte’s ‘Crescent and Wedge’
In July of 2024, Charlotte came in thirty-eighth out of fifty metro areas on a scale of economic mobility in the US.7[7] Leading on Opportunity, “Charlotte Improves National Ranking On Economic Mobility, Moves To No. 38,” Leading on Opportunity, Jan. 6, 2025. Accessed at leadingonopportunity.org/charlotte-improves-national-ranking-on-economic-mobility-moves-to-no-38/ Ten years earlier, it had been ranked fiftieth, according to what has become known colloquially as “the Chetty report,” named after its lead author, Raj Chetty.8[8] Chetty et al., “Where is the land of opportunity? The geography of intergenerational mobility in the United States,” 2014. The 2024 report further found that Charlotte was among the cities in which outcomes for low-income Black children had improved the most over the previous ten years, while outcomes for low-income white children in Charlotte were unchanged, bringing those outcomes closer.9[9] Chetty et al., “Changing Opportunity,” 2024. See specifically pp. 3, 5, 16, 87, and 88.
Charlotte’s inequality is often visualized as a crescent and a wedge. The “wedge” indicates neighborhoods in the southern quarter of the city that have the highest household incomes, highest average levels of education, and highest percentages of white residents, while the surrounding “crescent” neighborhoods have the highest percentage of Black and Hispanic residents and tend to score much lower on nearly every measure of individual and community prosperity. This reality means that not all Charlotte residents have benefited from the city’s dynamism over the past decade-plus.
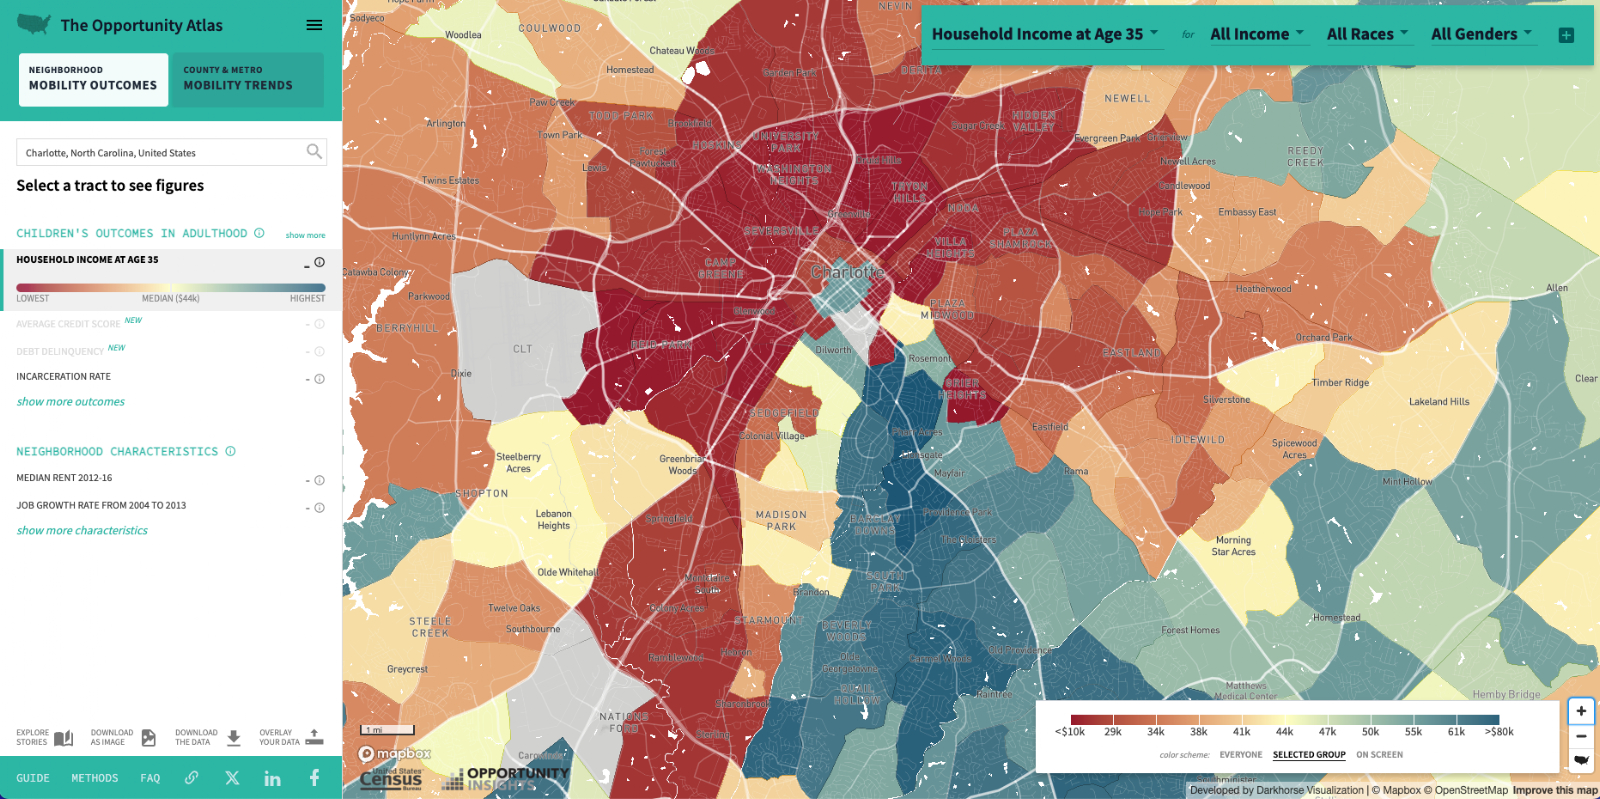
Figure 1: Map of Charlotte that accompanies the Chetty report, showing household income by census tract, reflecting the “wedge and crescent” pattern.
What are the implications for local news and civic information in Charlotte? Does the availability of local news track patterns of inequality on the ground? Or is the local news and information landscape working to mitigate structural inequality?
A Census of Local News Providers
By their nature, cities are more likely than rural areas to have ample local news provision: higher population density, younger-than-average inhabitants, and higher-than-average median household income are all positively associated with local news oases.10[10] See, e.g.: A.Y. Qin, “Where Is Local News Dying Off? Mechanisms Behind the Formation of Local News Deserts in the United States,” 2024; V. Saiz-Echezarreta, B. Galletero-Campos, and D. Arias Molinares, “From news deserts to news resilience: Analysis of media in depopulated areas,” 2023. New research has also found that people who live in cities and other densely populated areas are the most likely to pay for news.11[11] “Americans Largely Not Supporting, Trusting, or Reading Traditional News,” American Communities Project, Dec. 11, 2025. Charlotte is no different; by using a deliberately broad and inclusive definition, we found sixty-six local news providers serving the city. But we also found neighborhoods with content gaps, which we define as areas outlets claim to cover but in fact do not, a close relative to “ghost papers.”12[12] “Ghost papers” are defined as outlets that claim to cover certain communities but do not. P.M. Abernathy, “The expanding news desert,” 2018.
While capital-J journalism remains the cornerstone of a fact-based news and information landscape, research shows that people in the digital age get useful, fact-based civic information from a wide variety of sources.13[13] E.g., E. Tomasik and K.E. Matsa, “1 in 5 Americans now regularly get news on TikTok, up sharply from 2020,” Pew Research Center, Sept. 25, 2025. Accessed at pewresearch.org/short-reads/2025/09/25/1-in-5-americans-now-regularly-get-news-on-tiktok-up-sharply-from-2020/ Broadening the lens to include organizations and individuals creating or amplifying fact-based local news and information allows us to capture that variety, and therefore to more closely approximate local news diets. This includes, for example, podcast-based providers that focus on local sports, such as the LockedOn podcasts about the Charlotte Hornets and Carolina Panthers, as well as Substack-native startups, like the Charlotte Optimist. More broadly, culture-driven content has repeatedly been shown to drive reader- and viewership for local outlets, thus resulting in revenue and greater engagement with the full breadth of an outlet’s content.14[14] E.g., M. Prior, “Post-Broadcast Democracy: How Media Choice Increases Inequality in Political Involvement and Polarizes Elections,” Cambridge Studies in Public Opinion and Political Psychology (Cambridge University Press, 2007).
Faith-based outlets are also included in this report; they are instruments of community cohesion and providers of niche local news15[15] See, e.g., “Faith-based Solutions Journalism,” Solutions Journalism Network, June 2023. solutionsjournalism.org/resources/faith-based-solutions-journalism, and there is a precedent for faith-based and ethnic outlets to be included in studies of community media.16[16] E.g., A. Advincula, “The State of Ethnic and Community Media in New Jersey,” Center for Cooperative Media, May 2023. centerforcooperativemedia.org/wp-content/uploads/2025/10/Copy-of-ECM_report_MAY2023-1.pdf Radio stations were included if they had a dedicated “local news” subpage on their website or local news, local sports, or local talk somewhere in their branding.17[17] There are two media groups that own a number of commercial radio stations operating in Charlotte: Urban One and Beasley Media Group. Most of the stations owned by both have dedicated subpages for local news on their websites, but the pages are identical across properties, with the exception of one outlet owned by Urban One (WBT-AM/FM), which has a full news staff, and Fox News Charlotte, owned by Beasley. To avoid inflating the number of local news providers, the remaining stations owned by Beasley (N=4) were counted as one, and the remaining stations owned by Urban One with the exception of (N=4) are counted as one. The other rationale for combining them is that any partnership or intervention to reach those audiences would go through a central office. The number 66 results after combining the Beasley and Urban One radio stations; the number before combining them is 73 (73 – 9 + 2 = 66). Using this more expansive definition results in a larger number of outlets than are reported in other mapping efforts. (See Appendix A for a brief review of the findings from other mapping studies of Charlotte.)
It is still useful, however, to distinguish outlets that produce accountability journalism from those producing other civic information. Here, we distinguish journalism outlets by adding two additional variables: whether an outlet acts as a watchdog, and whether it employs any staff who identify or are identified as journalists. Outlets that meet both criteria are termed local journalism originators. Table 1 lists the Charlotte-serving local news and information providers included in our study, broken down by whether they are counted as a local journalism originator, primary medium, community served, year founded, ownership location and type, and whether we analyzed their content.
Table 1: Charlotte local news providers (alphabetical by name of provider)
Characteristics of Charlotte Local News Outlets
Of the sixty-six Charlotte-serving local news providers we identified, thirty-two outlets were determined to be local journalism originators (LJOs). The thirty-four outlets that are not LJOs either do not employ journalists or do not provide a watchdog function, meaning they do not act as a check on those in power. These include some culture and lifestyle outlets, which may have journalists on staff but do not produce accountability journalism, as well as local sports blogs, which may be critical of those in power but do not employ anyone who is characterized as a journalist. Another example of an outlet not counted as a local journalism originator is the app Newsbreak, which was identified in a recent report as an important source of local news for Black Charlotteans18[18] UNC Charlotte Urban Institute, (2025), “Local News & Information: Historic West End.” but is an AI-driven aggregator.
The numbers below are based on all sixty-six outlets unless otherwise indicated.
Medium
Perhaps surprisingly, fifteen Charlotte-serving outlets (23 percent of the total) still publish in print (see list below). It is notable that all but three of the outlets that publish a print product cater to a specialized audience, such as a religious, ethnic, or identity-based group (these are indicated below by an asterisk). Research has shown that news outlets catering to these communities have an easier time selling print advertising because their audiences tend to be loyal to both aligned local businesses and specialized outlets.19[19] Sarah Stonbely and Anthony Advincula, “The state of ethnic and community media in New Jersey,” June 2019, Center for Cooperative Media, https://centerforcooperativemedia.org/research/state-of-nj-ethnic-community-media/
Charlotte-serving print publications
Catholic News Herald*
Charlotte Business Journal*
Charlotte Jewish News*
Charlotte Observer
Charlotte Post*
Hola News Charlotte*
La Noticia Charlotte*
Mecklenburg Times
Mundo Latino*
Progreso Hispano News*
Qnotes Carolinas*
Que Pasa Charlotte*
Saathee*
South Charlotte Weekly
The Voice (Greek Orthodox)*
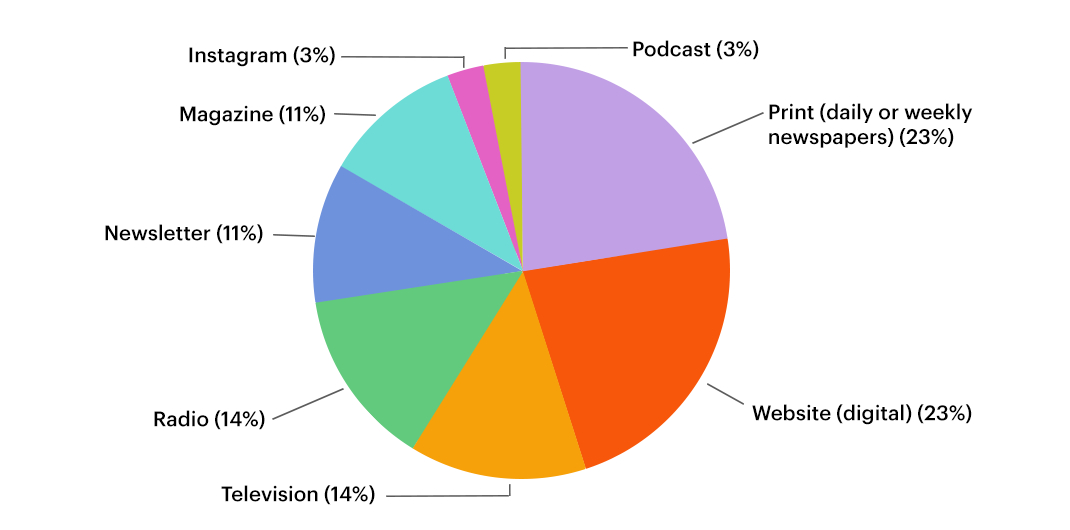
Figure 2: Primary medium for Charlotte local news providers
Communities Served
Nineteen of the sixty-six local news providers (29 percent) serve a nonwhite or ethnic audience. Eleven of those nineteen are designated as LJOs. The other eight include faith-based outlets such as the Charlotte Jewish News; those focused primarily on lifestyle and culture, like Pride Magazine; and local commercial radio stations, which carry some local news within a music-first format. In terms of audience, ten of the nineteen serve Hispanic communities, relaying news in Spanish (one, Enlace Latino NC, also publishes in English). Another five explicitly serve Black Charlotteans, though several more (such as Newsbreak) have sizable Black audiences.20[20] “Local News & Information: Historic West End,” UNC Charlotte Urban Institute, pp. 12–13. The remaining outlets serve Jewish, Greek Orthodox, and Asian communities.
It is likely that this number, nineteen, is an undercount. Capturing local outlets that serve minority communities (whether ethnic or identity-based) and those that publish in a language other than English has some well-established difficulties, including that they are less likely to be included in PR-oriented databases such as Cision, on which many maps rely for baseline lists. They are also more likely than mainstream (i.e., English-language and general-audience) outlets to appear only in print, or to live entirely on a platform such as WhatsApp, making them less prominent or even invisible in online searches for news outlets serving a particular area. We will discuss ideas for better capturing these outlets in the Conclusion and Recommendations sections.
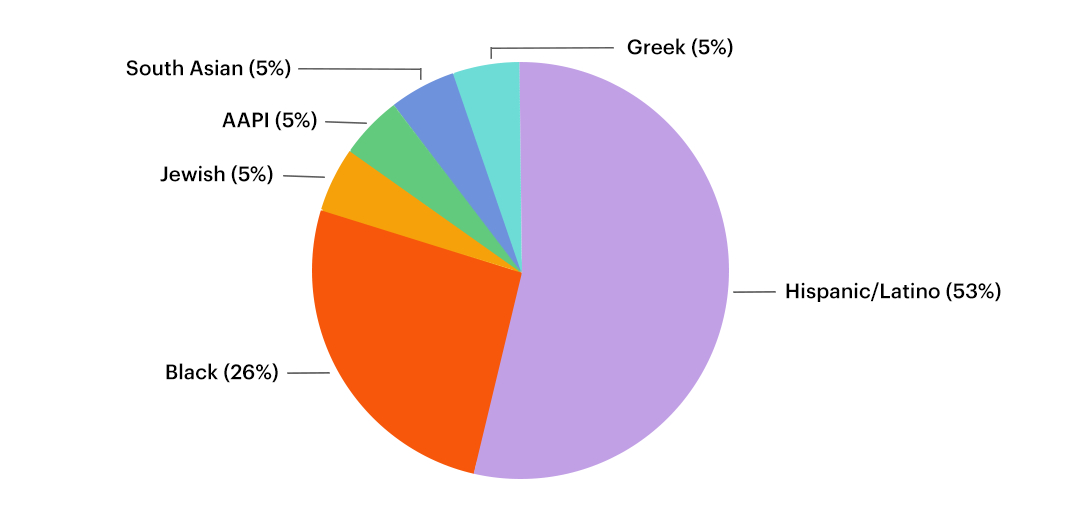
Figure 3: Percentage of local news providers serving nonwhite/ethnic audiences (N=19)
Year Founded and Business Models
The oldest outlet serving Charlotte is the Charlotte Post, which was founded in 1878 (the Charlotte Observer, founded in 1886, is a close second). The newest outlets were founded in the past year or two and are newsletter-based (the Charlotte Optimist and tiny money). Twenty local news outlets have launched since 2000, with seven of those forming since 2020, showing that people are still willing (and able) to find new ways of providing local news if the conditions are right.
In terms of business model, the overwhelming majority of Charlotte-serving outlets (fifty-four, or 82 percent) are for-profit, mainly relying on a mix of advertising and sponsored content. The twelve that are not for-profit include: The Charlotte Optimist, Enlace Latino NC, and North Carolina Health News (of which the last two are statewide), as well as three public media outlets (WFAE, WTVI, and WNSC) and a combination of faith-based, university-based, and alternative structures. Within the broad categories of for-profit and nonprofit, there is a wide variety of revenue streams. Substack-based for-profit providers, for instance, also draw income from audience revenue, and while all of the nonprofits rely on audience revenue, some are also subsidized by philanthropy or advertising.
Public media across the country took a hit in 2025 when the Trump administration rescinded all public funding for the Corporation for Public Broadcasting.21[21] Newman and Schapitl, “Congress rolls back $9 billion in public media funding and foreign aid,” July 18, 2025. Accessed at npr.org/2025/07/18/nx-s1-5469912/npr-congress-rescission-funding-trump WFAE, Charlotte’s public radio station, is still regaining its footing after losing 10 percent of its annual budget. Corporate underwriting is soft, according to Ely Portillo, WFAE’s executive director22[22] In-person event, Nov. 15, 2025., as longtime supporters are now leery of having their name associated with public broadcasting. But Portillo was happy to report that, as of November of 2025, the community had stepped up and, for the moment, audience revenue was allowing WFAE to continue to provide some of the most accessible local reporting in Charlotte and beyond.
Ownership
We were able to document ownership for sixty-three of the sixty-six outlets in our study. Of those, forty-two (67 percent) are locally owned, meaning their ownership is based in Charlotte or elsewhere in North Carolina. Local ownership has been shown to be crucial for the quality of local journalism in myriad ways, resulting more often in original reporting about the communities it serves.23[23] E.g., S. Bisiani, A. Gulyas, and B. Heravi, “Mapping News Geography: A Computational Framework for Classifying Local Media Through Geographic Coverage Patterns,” Anthology of Computers and the Humanities. Accessed at anthology.ach.org/volumes/vol0003/mapping-news-geography-computational-framework-for/
One example of a locally owned outlet is a blog devoted to the Charlotte Hornets basketball team called At the Hive. Its current owner is Jonathan DeLong, who bought it in 2023 from SB Nation, a sports blog company owned by Vox, which owns another Charlotte sports blog, Cat Scratch Reader, also included in our analysis. DeLong posted about buying At the Hive in 2023, and his post shows both the importance of local ownership as well as the community that non-journalism news outlets can create. He begins:
As many of you probably know because you asked me about it a million times in various comment sections, At The Hive is its own independent entity now. We’re going to do our best to continue to provide Charlotte Hornets related content on an Internet that is usually devoid of such places while maintaining the community that you all made the best place to talk about Hornets basketball.
He then discusses the tweaks he’s making, before closing with:
Let’s keep this train running. The Hornets are heading towards probably the most important offseason in recent memory, and we’ll be here to provide news and analysis every step in the way while providing a platform for fans to talk about it.24[24] DeLong, “The new At the Hive for Charlotte Hornets fans,” At the Hive, April 3, 2023. Accessed at atthehive.com/2023/04/03/charlotte-hornets-news-community-blog-we-back/
The twenty-one nonlocal owners include large media companies like Axios, Charter, and Nexstar, each of which owns one Charlotte outlet, as well as McClatchy and Tegna, each of which owns two. They also include digital-first owners like 6AM City, which runs a lifestyle newsletter about Charlotte, and Morris Media, which is based in Georgia and abruptly shut down Charlotte magazine earlier this year, prompting community outcry.25[25] K. Peralta Soloff, “Charlotte magazine will shutter after nearly six decades,” Nov. 6, 2025. Accessed at axios.com/local/charlotte/2025/11/06/charlotte-magazine-will-shutter-after-nearly-six-decades. Morris Media shut down Charlotte Parent, also a monthly magazine, at the same time; however, these two outlets are still included in our calculations because of when we began our analyses.
Charlotte Journalism Collaborative
A notable asset of the Charlotte local news and information landscape is the Charlotte Journalism Collaborative, directed by Chris Rudisill and housed at Queens University of Charlotte. The CJC is a vital “backbone” organization that brings together nine local organizations—six news outlets and three CSOs26[26] The organizations that make up the CJC are: Charlotte Observer, La Noticia, QCityMetro, Qnotes, WCNC, WFAE, Charlotte Mecklenburg Library, Knight School of Communication at Queens University of Charlotte, and Charlotte Urban Institute.—to collaborate and amplify one another’s work. The CJC is a model for how local news providers and CSOs can work together; across several projects, Rudisill and CJC members find common ground on which they build plans for coordinated coverage, events, and resource sharing. For example, ahead of the 2024 midterm elections, the collaborative created an “election hub” where they shared Spanish-language translations of stories, conducted a survey of candidates, shared resources, and amplified each other’s content.27[27] “CJC 2025 Annual Report,” Charlotte Journalism Collaborative, charlottejournalism.org/wp-content/uploads/2025/08/CJC-2025-Annual-Report.pdf
The Charlotte Journalism Collaborative also holds an annual Local News Impact Summit, which brings together funders, advocates, community members, publishers, reporters, and local civil society organizations to discuss the most pressing issues facing the city and how they can pool expertise and resources for greater impact.28[28] See charlottejournalism.org/cjc-2025-local-news-impact-summit/ Gatherings like this build bridges between individuals and groups who might be working toward a common purpose but have nevertheless not had the chance to meet or talk. As the concept of “who counts” in a local mediascape expands, collaboratives like the CJC are crucial nexuses for funders and publishers alike because they can foster connections and make the most of existing resources.
Topics Covered by Charlotte Local News and Information Providers
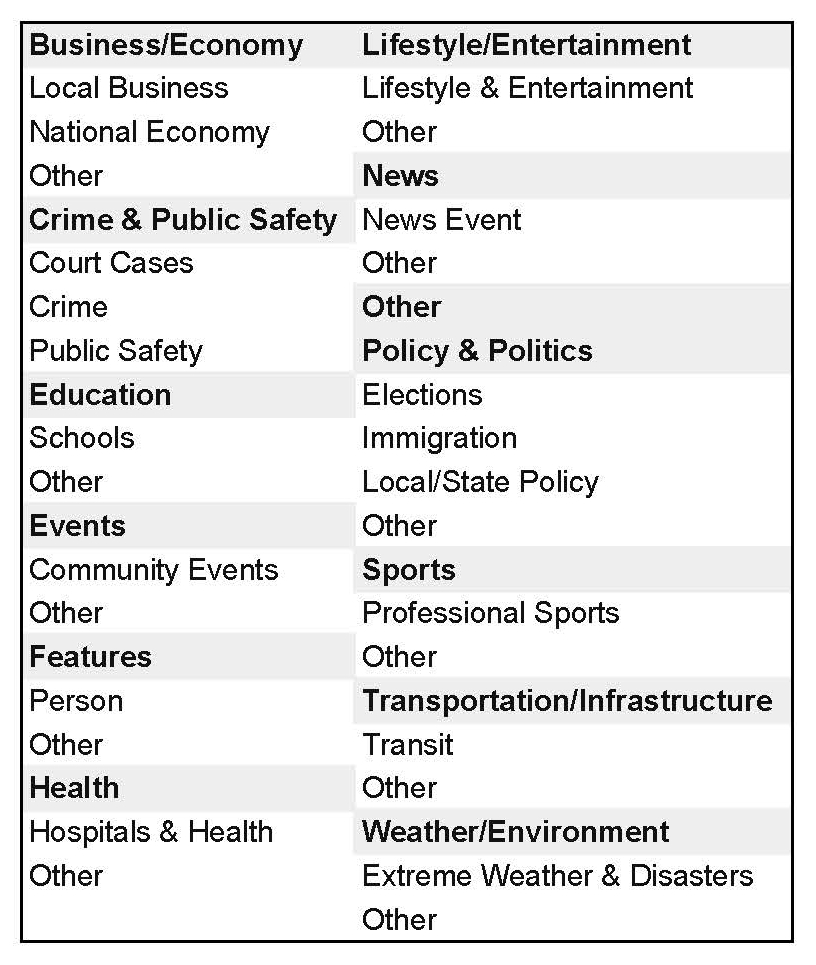
In addition to the local news outlet census, we produced two tools with which to analyze Charlotte local news and civic information: one to code and analyze articles by topic, and another to map coverage areas according to locations mentioned in each article. We’ll focus first on the topic analysis. In total, we analyzed 18,234 articles by both local news outlets and CSOs (see Appendix B for a detailed methodology). The topics (and subtopics) we used were as follows:
The tool to analyze topics is called a semantic map, and it clusters articles with similar topics together. Figure 4 shows the semantic map for every article we analyzed. It is important to note that the semantic map presents similarity or difference on x and y axes, not based on cardinal directions or political right and left (i.e., the placement of different topic clusters is arbitrary).
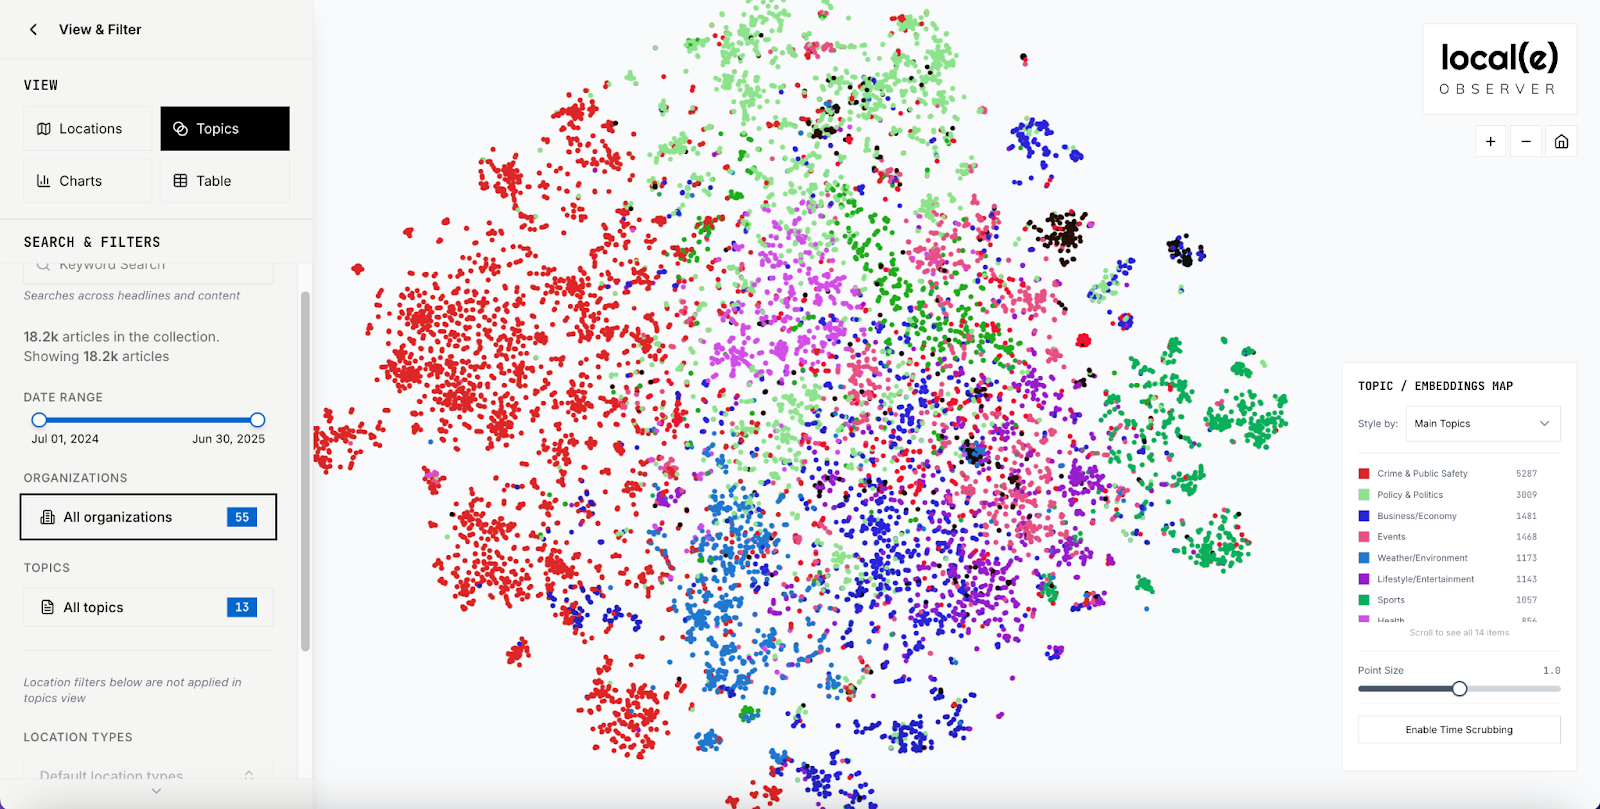
Figure 4: This semantic map shows all the articles included in our analysis.
The semantic map allows for selection by organization and topic; it also has keyword search and a longitudinal function that shows change over time. Hovering over one of the dots brings up a tooltip that displays details about the story (headline, dateline, topic, and lede), and a user can click through to read the story. In the figure above, all organizations and all topics are selected; when filters are used, some of the dots become gray, showing which stories were not selected. The online, interactive version of the map is currently available to select funders and publishers only.
We’ll focus first on comparing local journalism originators to the rest of the local news providers, sorting by community served (comparing Spanish-language and Black-oriented outlets to the general-audience outlets) and local versus out-of-town ownership. Then we will explore how content produced by civil society organizations differs from or is similar to that published by local news providers.
Differences Between Local Journalism Originators and the Rest of the Field
Because most of the news outlets whose content we analyzed were local journalism originators (LJOs), it makes more sense to filter the map for non-LJOs, which include Catholic News Herald, Charlotte Jewish News, CLTtoday, CLTure, Saathe, Soccer Sheet, and tiny money. Figure 5 shows the semantic map for those outlets only; the dots represent topics covered.
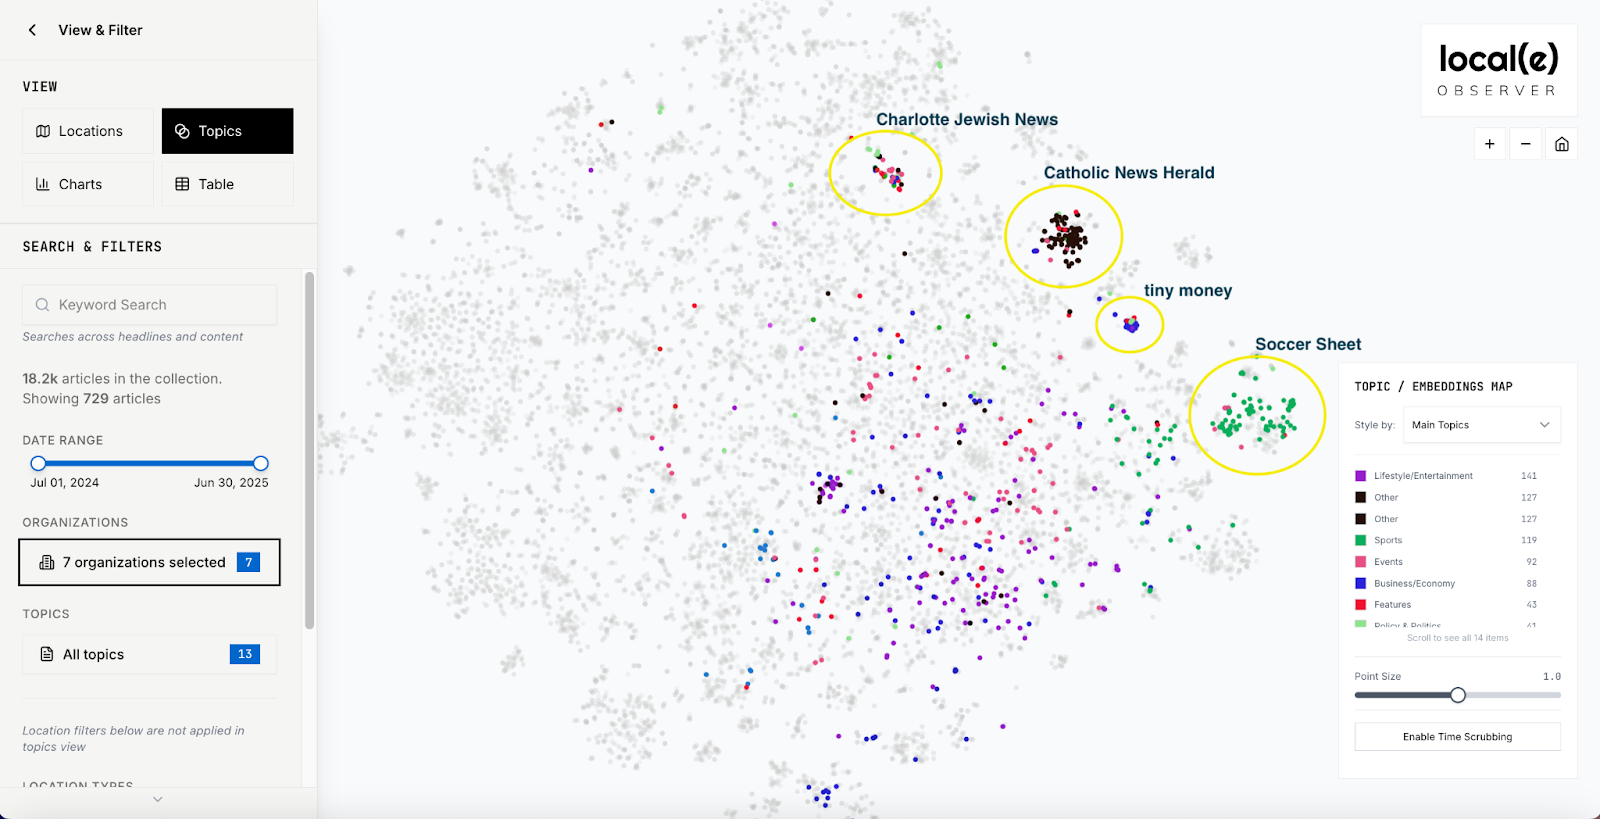
Figure 5: Semantic map showing non-LJO news providers by topics covered.
The four clusters in the upper right quadrant represent Charlotte Jewish News, Catholic News Herald, tiny money, and Soccer Sheet. The relative isolation of these clusters shows that they are largely providing unique content, at least in the context of the organizations we analyze here. Figure 6 shows the same thing, except in that case, the dots are coded by provider. Of interest here is the breadth of topics covered by CLTtoday (the widely scattered green dots).
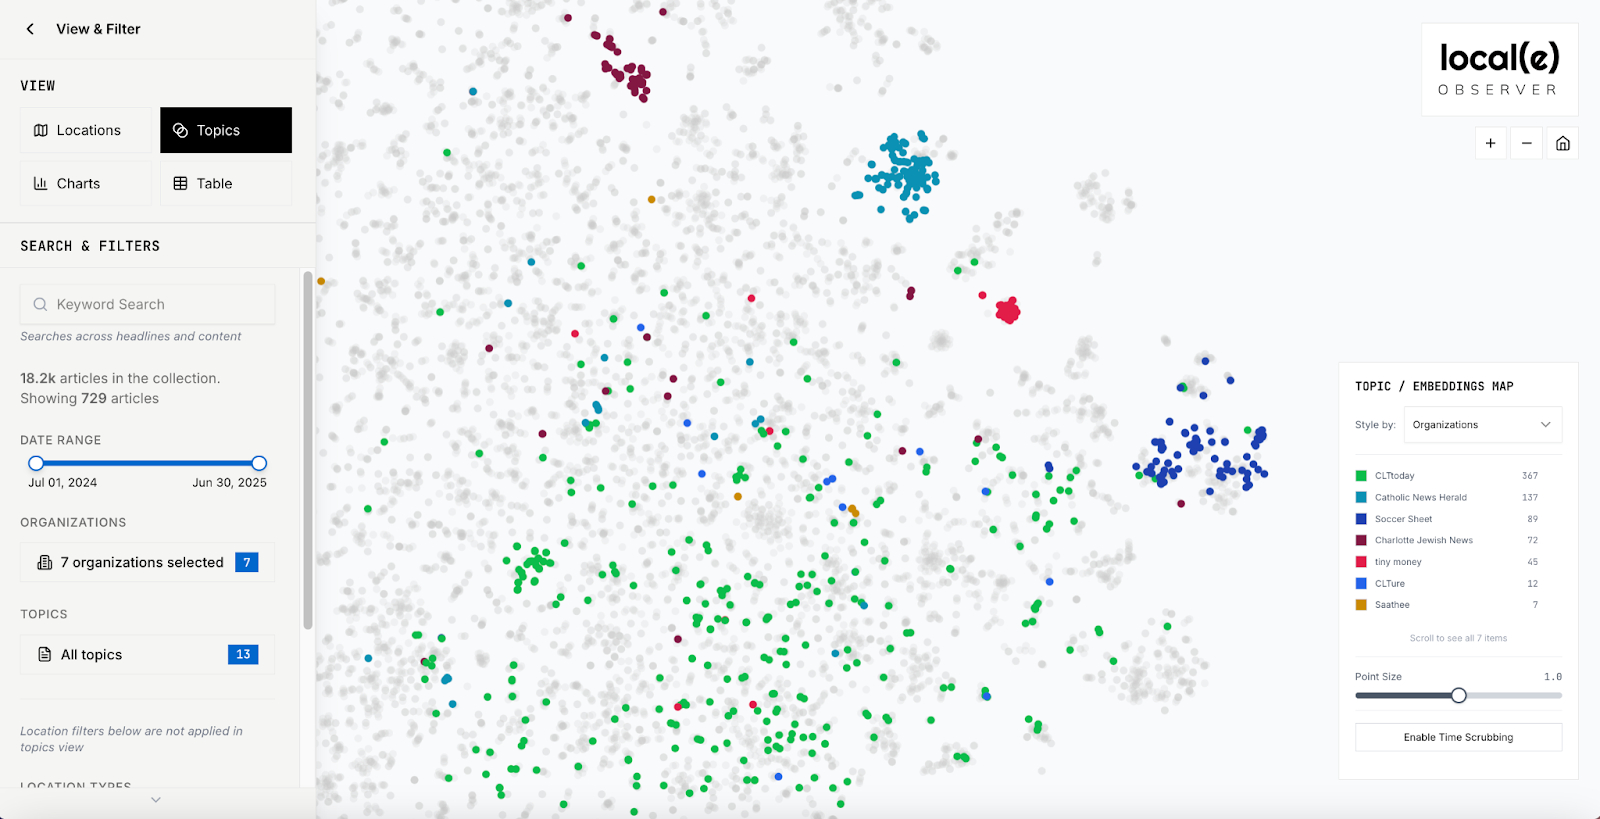
Figure 6: Semantic map showing non-LJOs, coded by provider.
CLTtoday is a daily newsletter from 6AM City, which operates more than three hundred and fifty AI-generated newsletters across the country.29[29] A. Deck, “6AM City acquires Good Daily’s network of more than 350 AI-generated local newsletters,” NiemanLab, July 24, 2025. Accessed at niemanlab.org/2025/07/good-dailys-network-of-more-than-350-ai-generated-local-newsletters-finds-a-buyer/ CLTtoday’s format includes one or two local news stories alongside event announcements, restaurant recommendations, and other types of sponsored content. One recent day, the featured local news story was headlined “Charlotte Hornets partner with Honeywell to deploy AI technology”; a quick Google search for the headline returned two press releases and a story from Axios Charlotte with a nearly identical title (Figure 7). The similarity of the content suggests that CLTtoday is using AI to find and repurpose stories from press releases and other local providers.
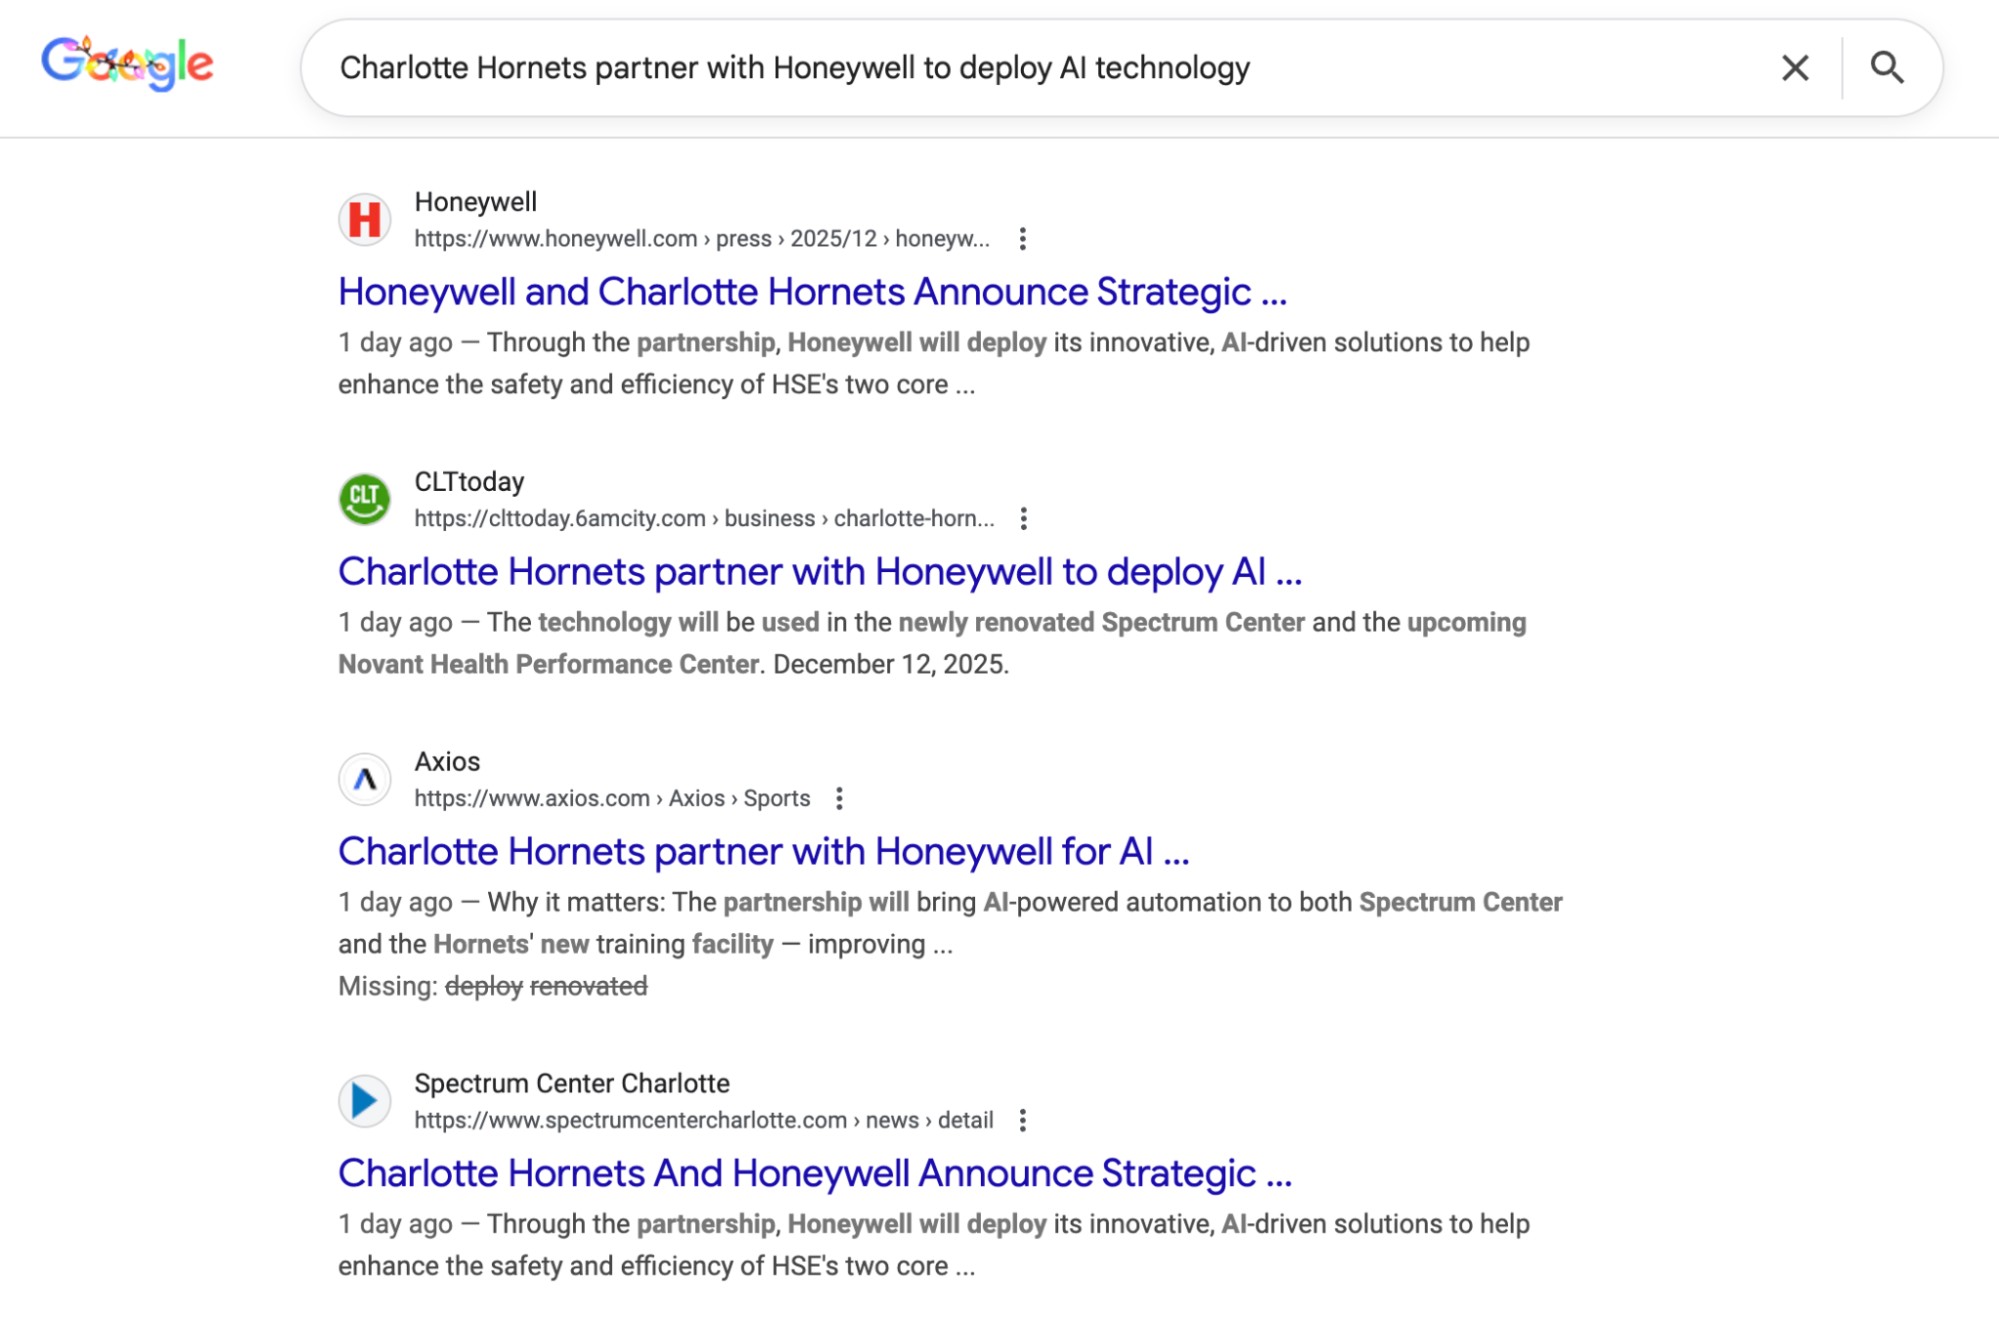
Figure 7: A Google search shows a CLTtoday headline and other providers with very similar content.
Topic Coverage for Spanish-Language and Black-Oriented Outlets
The semantic map can also be used to look at outlets oriented toward specific audiences. Figure 8 shows the six Spanish-language outlets serving Charlotte: Enlace Latino NC, Hola News Charlotte, La Noticia Charlotte, Progreso Hispano News, Que Pasa Charlotte, and WSOC Telemundo.
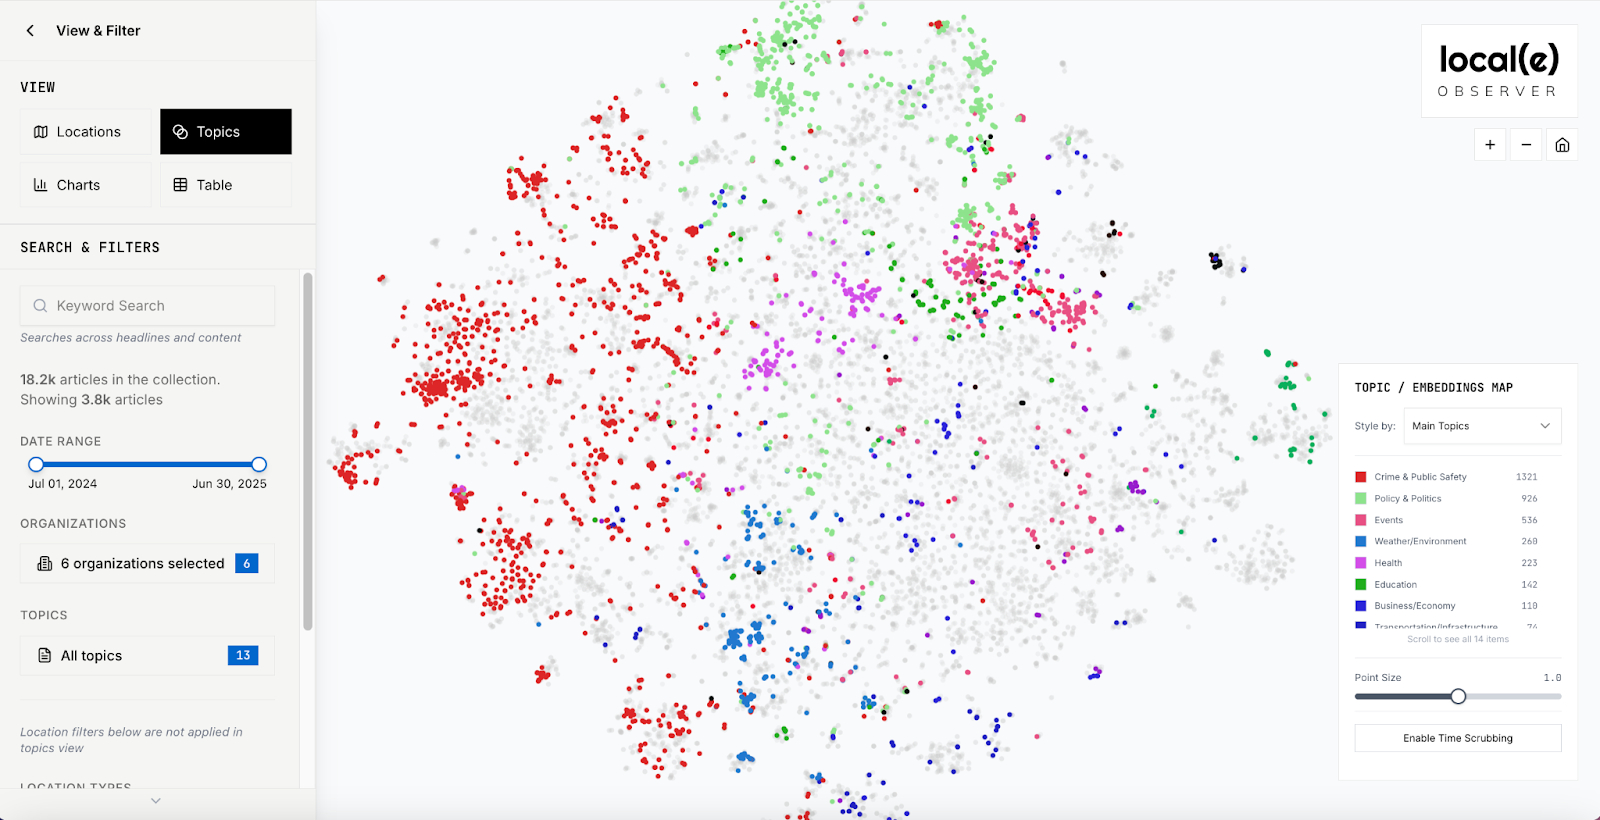
Figure 8: Semantic map showing topics covered by Spanish-language local news providers serving Charlotte.
The most covered topic in Spanish-language local news during our sample period was crime and public safety (1,321 stories focused on this, or 34 percent of all Spanish-language news), followed by policy and politics (926 stories, or 24 percent), and events (536 stories, or 14 percent). The bulk of the crime stories were about homicides (circled in Figure 9, in yellow). Missing people and accidents were also covered often, and the gray dots surrounding those clusters show that other providers were covering these stories as well.
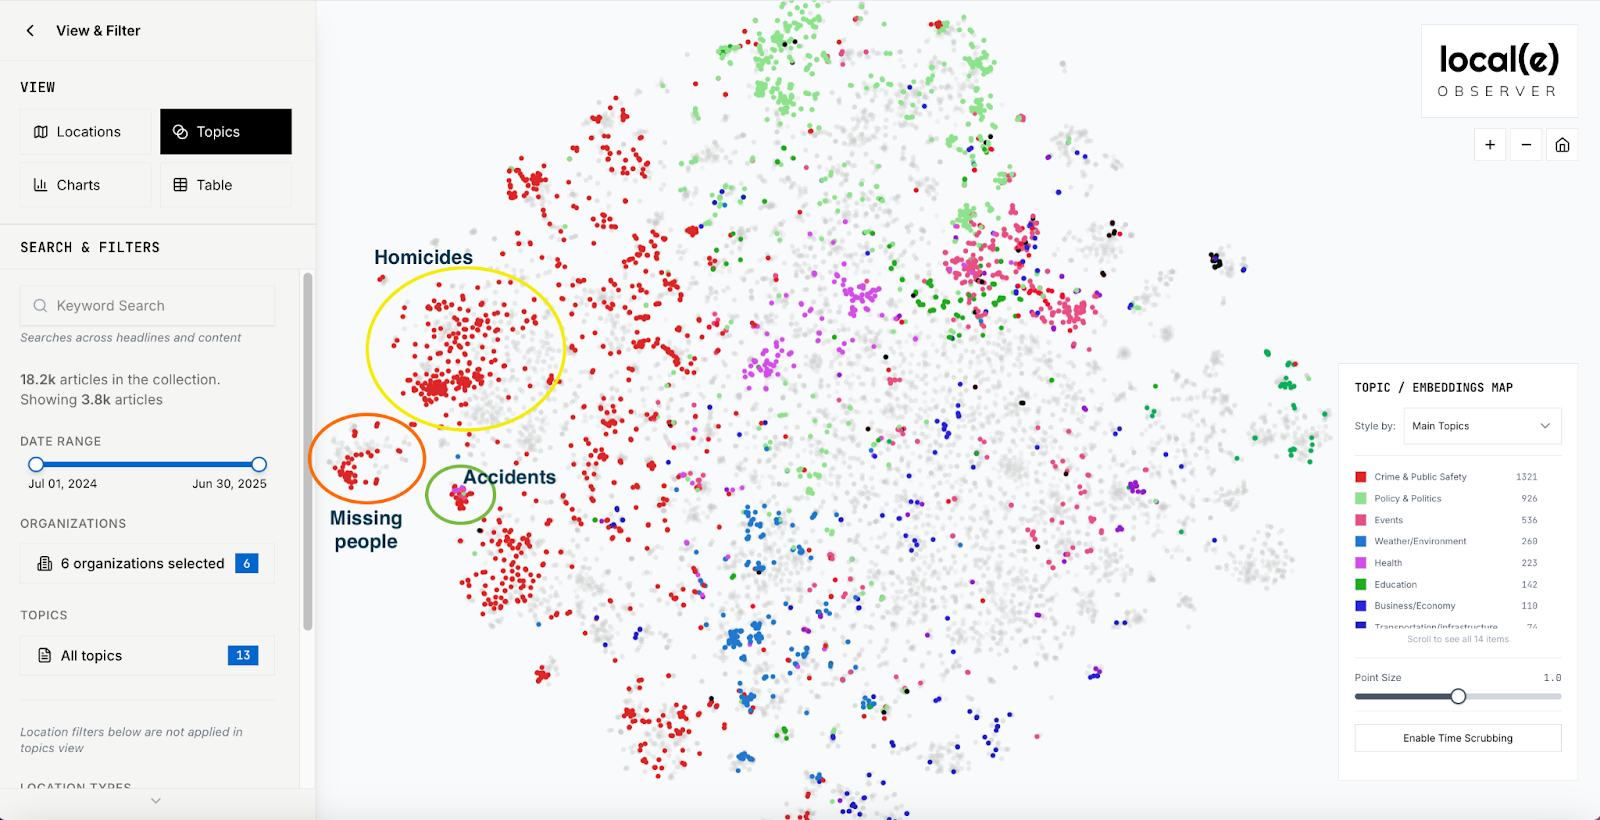
Figure 9: Crime stories in Spanish-language outlets.
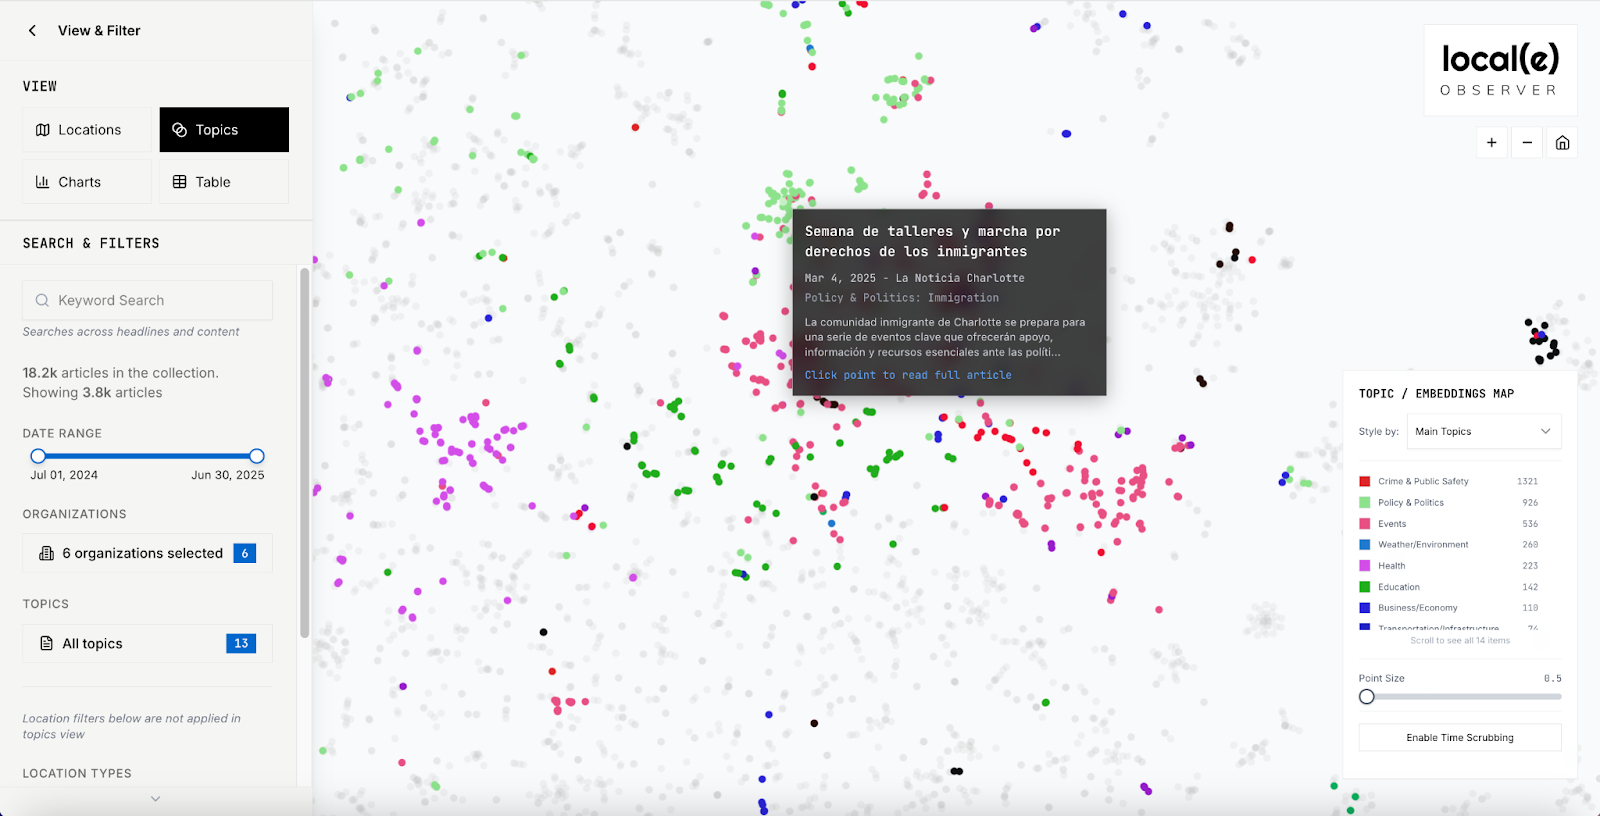
Figure 10: A Spanish-language outlet covering immigrants and immigration in March of 2025.
Many of the policy and politics stories by Spanish-language local news providers during our sample period—well before the immigrant roundups in Charlotte in November of 2025—were about immigration and immigrants’ rights.30[30] See also S. Stonbely, “Covering the Raids,” Columbia Journalism Review, Dec. 4, 2025, cjr.org/tow_center/immigration-enforcement-operations-in-north-carolina-highlight-the-importance-of-local-news.php The story highlighted in Figure 10 is about a series of marches and workshops about and for immigrants that occurred over a week in March of 2025. Figure 11 shows that very few other providers were writing about these topics at the time, as evidenced by the lack of gray dots in the area. Likewise, many of the event stories from Spanish-language outlets (the dark-pink dots) were about immigrants and immigration, which is why they cluster near the policy and politics stories (the light-green dots).
One coverage area relates to HB 10, the North Carolina bill requiring local sheriffs to cooperate with ICE. Figure 11 shows a cluster of stories related to the bill, all of which were published by the Spanish-language outlets. Enlace Latino NC followed the legislature’s movements particularly closely, publishing pieces like “What do North Carolina sheriffs think about the law that requires them to cooperate with ICE?” and “How Democratic representatives helped override the governor’s veto of HB 10.” The only mentions of HB 10 in English-language outlets, meanwhile, occurred in larger pieces related to the legislative session.
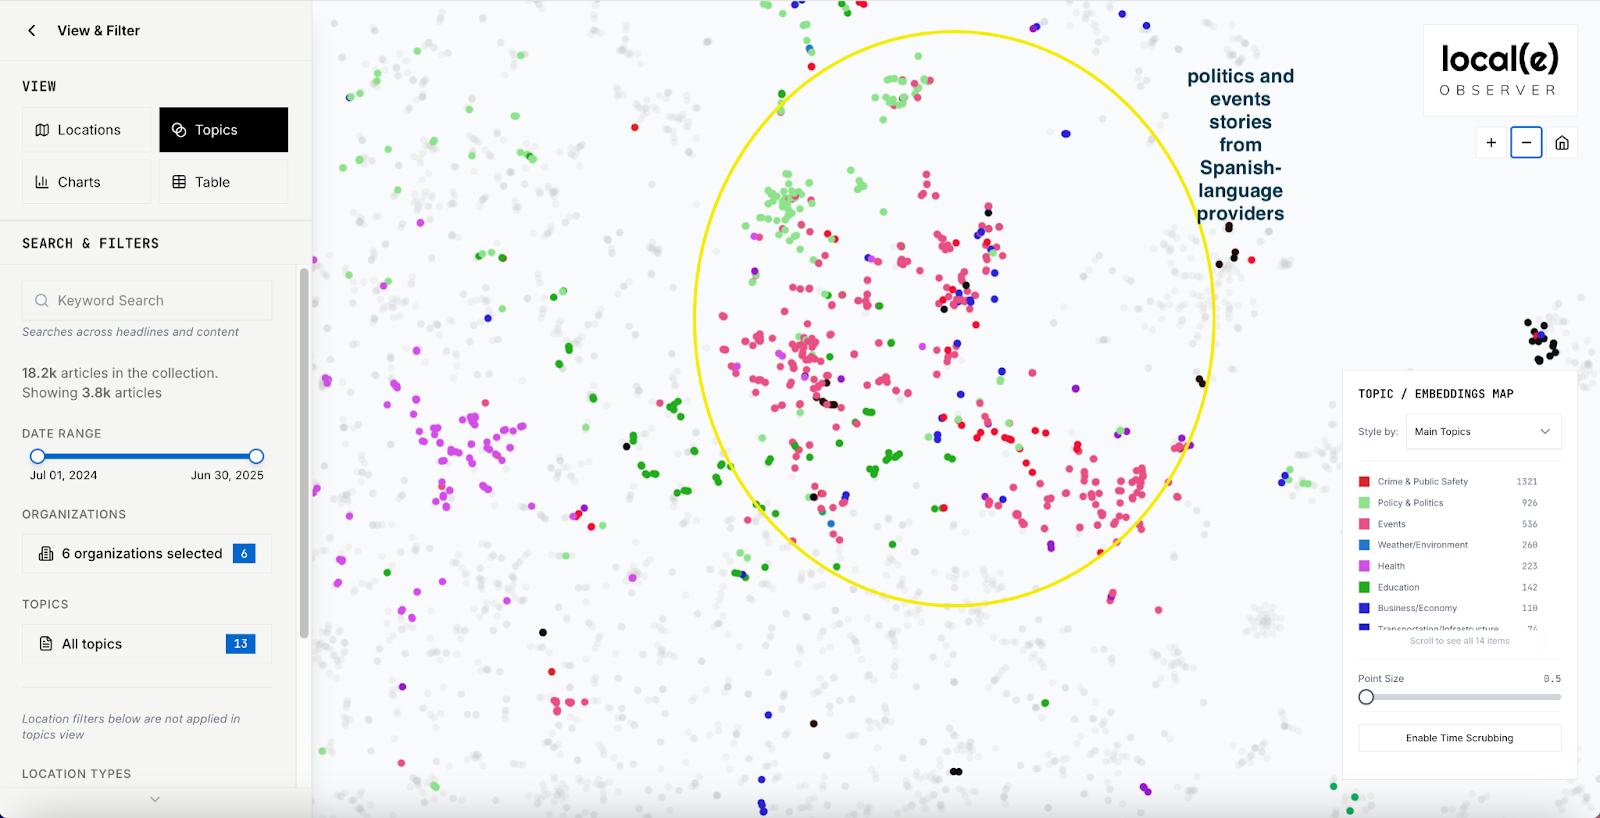
Figure 11: Stories from Spanish-language providers covering immigrants and immigration when few others were.
Unlike Spanish-language outlets, Black-oriented local news providers whose content we analyzed—QCity Metro and the Charlotte Post—produced very little crime coverage (Figure 12). Gerald Johnson, the publisher of the Post, prides himself on this fact, as he told me when we looked together at the Post’s coverage on the semantic map.31[31] Zoom call, Sept. 5, 2025. The Post also takes pride in covering Charlotte sports to an extent that few others do, as shown in the darker green dots at the right of the map in Figure 12.
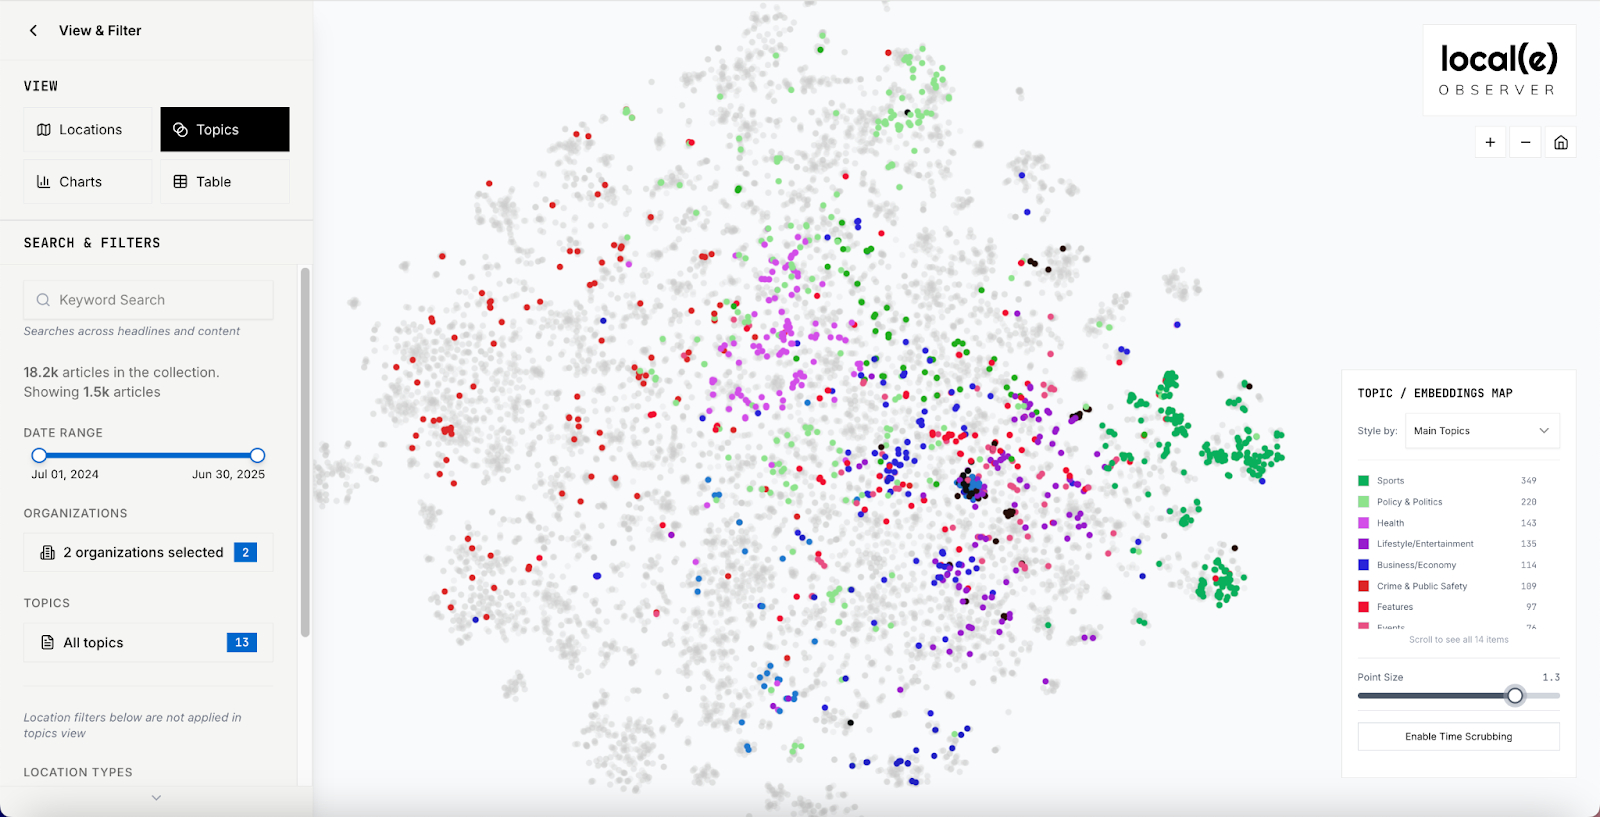
Figure 12: Topics covered by two of Charlotte’s Black-oriented outlets—less crime, more sports.
The semantic map tool allows users to change the view from topics covered to which organization covered them, as shown in Figure 13 (the hovering and tooltip features, as well as the topic clusters, remain the same). In this view, one sees that the Charlotte Post covers many local sports stories that others do not, including events at historically Black colleges and universities (HBCUs), as shown in Figures 14 and 15.
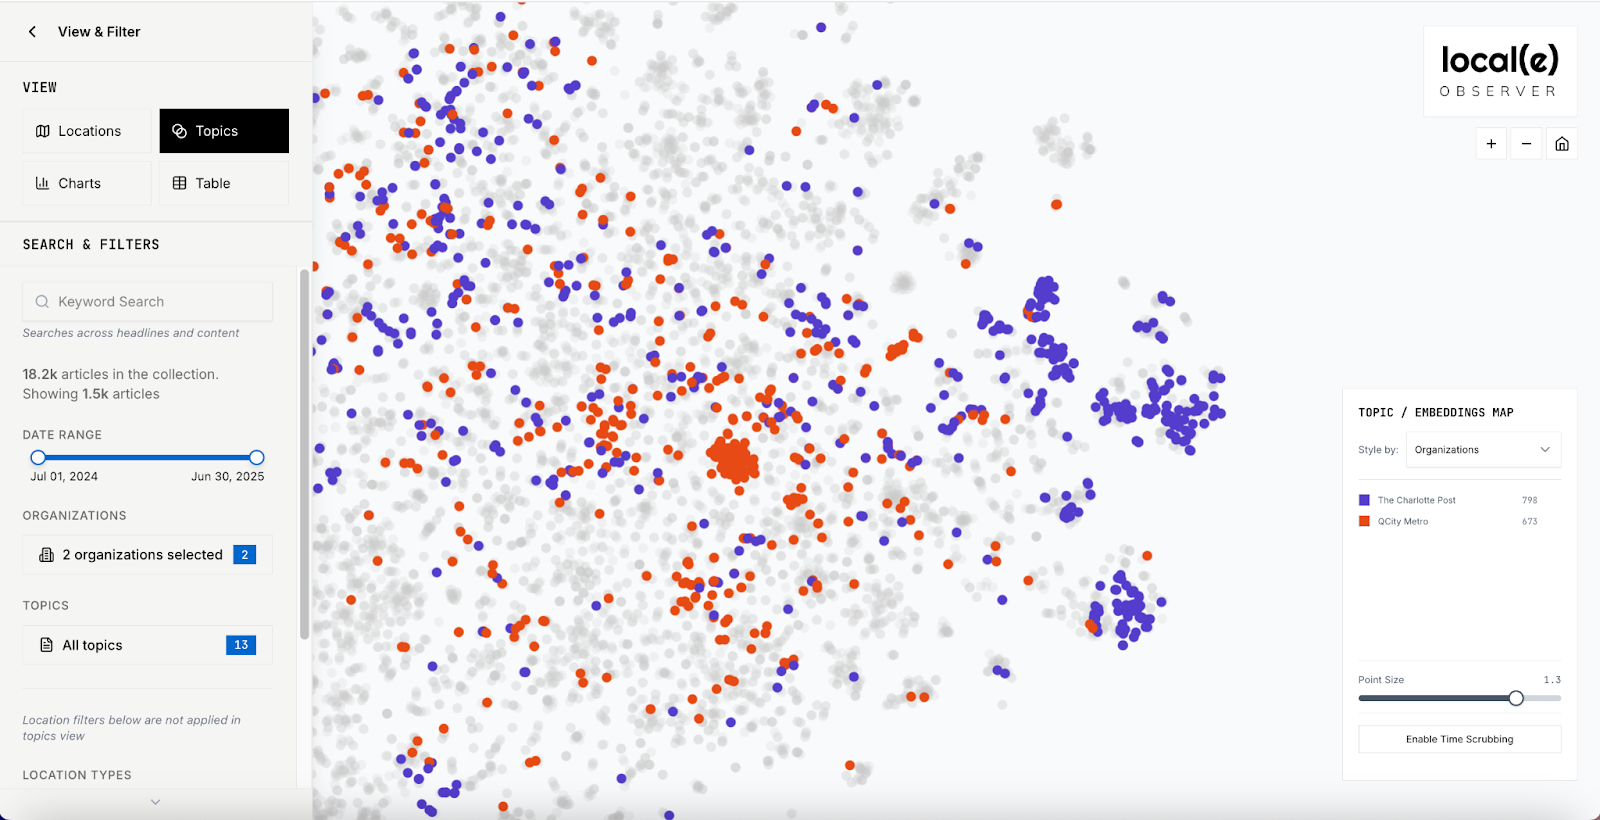
Figure 13: The semantic map showing stories by organization (the Charlotte Post in purple, QCity Metro in orange), rather than by topic, with sports still on the far right.
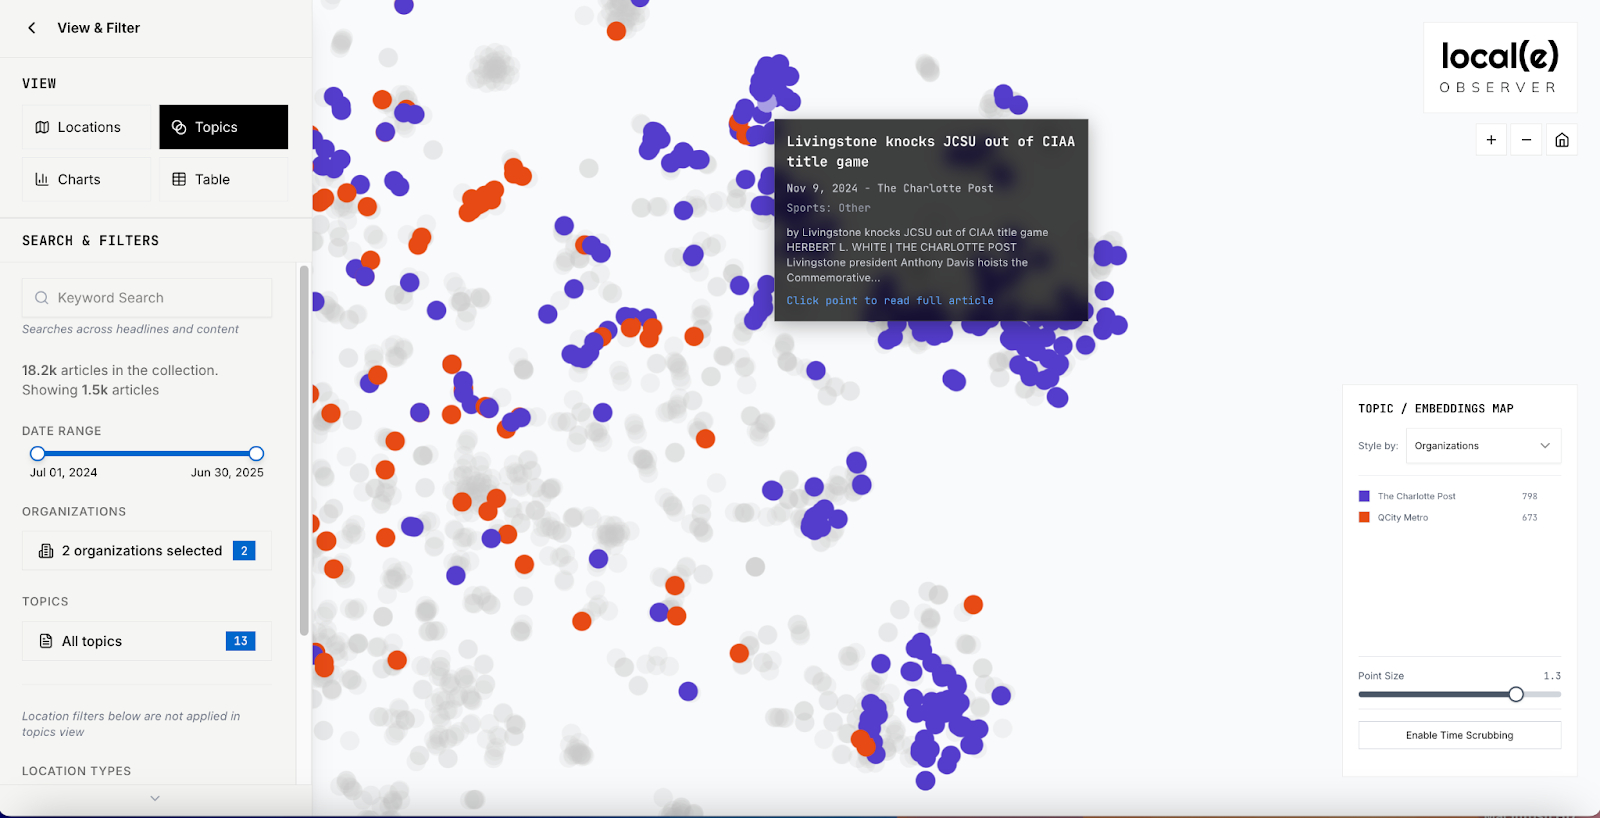
Figure 14: The Charlotte Post covers many local sports events that others do not, such as HBCU games.

Figure 15: A Charlotte Post story about an HBCU football game.
Topic Coverage Differences Between Locally and Remotely Owned Outlets
The impact of ownership on content is one of the oldest research topics in journalism studies, dating back at least to media policy debates around ownership consolidation in the 1980s. More recently, studies leveraging artificial intelligence, like ours, have begun to explore differences between local and remote ownership at scale. For example, Simona Bisiani and colleagues mapped local news coverage in the UK using a combination of named entity recognition and large language models.32[32] Bisiani et al., “Mapping News Geography.” This study yielded interesting insights about the structural properties of different local outlets as they relate to where ownership is based, finding that the quality of news, according to various measures, was lower under remote ownership.
We scraped the content produced by thirty-three local news providers serving Charlotte.33[33] See Appendix B for a detailed discussion of the method. Of those, twenty-two (67 percent) are locally owned, meaning the ownership is based in Charlotte or elsewhere in North Carolina. The most covered topic by locally owned outlets is health news, at 69 percent of total local news content. The least covered topics by locally owned providers are transportation/infrastructure and lifestyle/entertainment, at 25 percent and 27 percent, respectively.
While additional research is needed, this variation in emphasis may have more to do, in this case, with the categories themselves than with actual coverage patterns. Figure 16 shows only the stories coded as transportation or infrastructure. The infrastructure stories are scattered across the map, suggesting that the parameters for this category need to be fine-tuned. In addition, a relatively large number of stories coded as lifestyle/entertainment or transportation/infrastructure fell into the “other” subcategory, which will be reduced in future iterations.
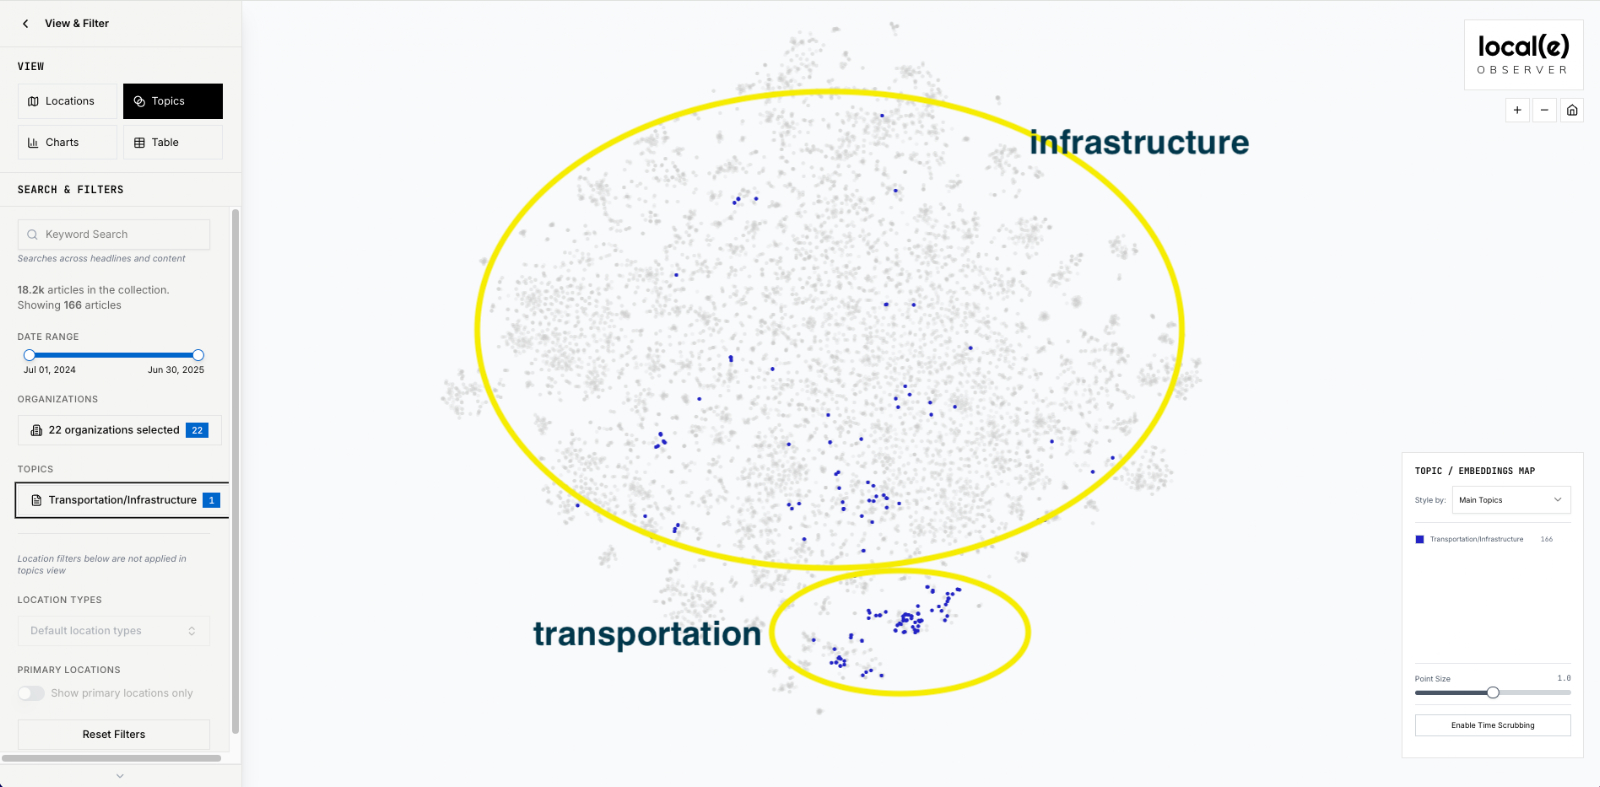
Figure 16: Refinement may be needed for the “infrastructure” category.
The large number of crime stories covered by outlets with out-of-town owners is due to the fact that the major Charlotte-serving local television news outlets (affiliates of ABC, NBC, CBS, and the CW) all have out-of-town owners, and television news makes up a large share of crime coverage in any local news sample.
Coverage Patterns (and Gaps) in Charlotte
In addition to analyzing the topics covered by Charlotte local news outlets, we also looked at the geographic spread of coverage to determine which communities receive robust coverage and which are hyperlocal news deserts. To do this, we developed a tool that geotags all relevant locations discussed in an article (see Appendix B for a detailed methodology). We then linked location mentions to census tracts and to broader socioeconomic characteristics using census data. We use census tracts as our unit of analysis because, at the city level, they are the administrative unit most closely correlated with neighborhoods. In addition, as census tracts are a common administrative unit across the US, they demonstrate the feasibility of our approach for any city or region in the country.
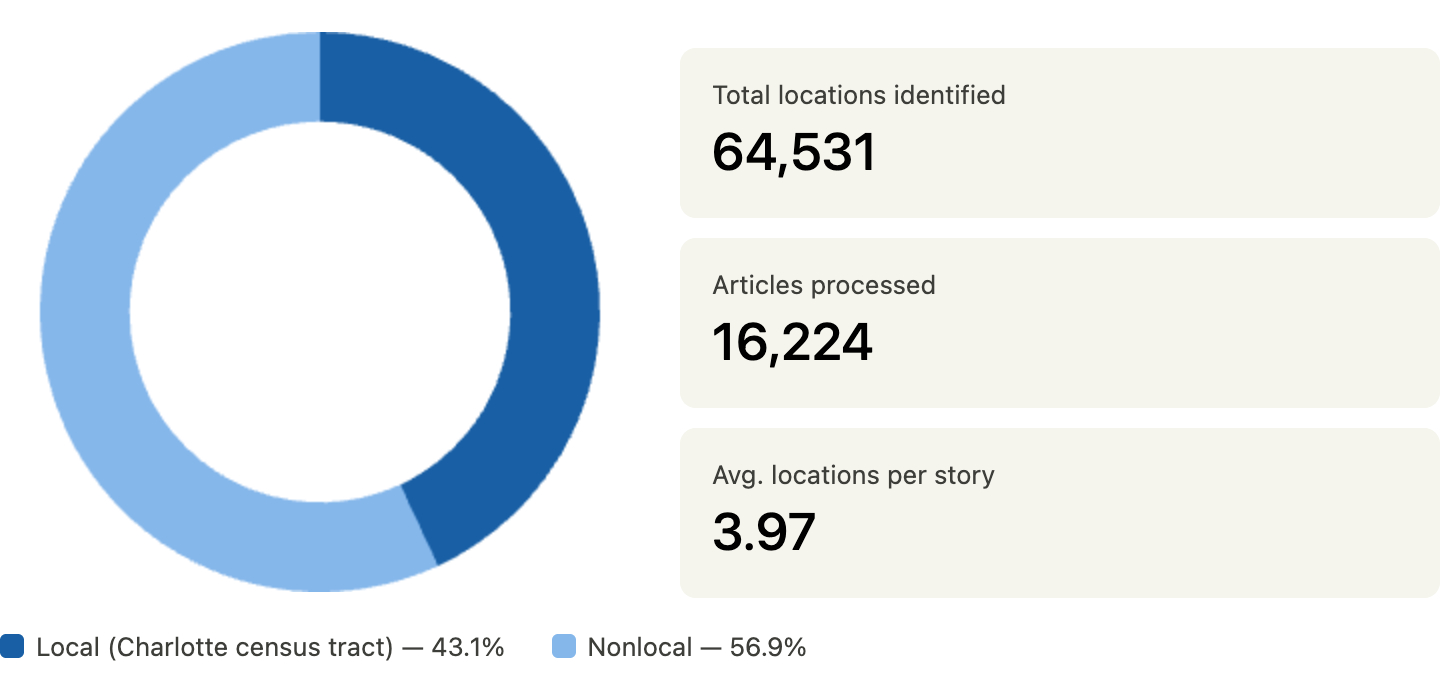
Overall, our model identified and processed 64,531 locations spanning 16,224 articles, of which 8,089 were unique. Among the articles that included mappable locations (not all did), the average number of locations mentioned was 3.97 per story. Of mentioned locations, 27,792 (43.1 percent) belonged to a Charlotte-designated census tract, meaning that most location mentions were nonlocal. The five most mentioned locations in all articles were Charlotte; North Carolina; Mecklenburg County; the United States; and Raleigh.
Of Charlotte’s 183 census tracts, roughly half (N=90) appeared in thirty or fewer articles, while fifty-two tracts received ten or fewer mentions. This geographic skew is mostly attributable to certain locations being mentioned in many articles. For example, the census tract with the highest number of mentions is Tract 5.01, which represents Center City and the Third Ward. Four hundred and eighty-seven articles mentioned a location in this tract (by comparison, each of the other tracts was mentioned in an average of 152 articles). Of the 487 articles based in Tract 5.01, 447 (91.8 percent) referred to Bank of America Stadium, the biggest sporting arena in Charlotte.
Similarly, the most mentioned location in Census Tract 1.04—also Center City, but the First and Fourth Wards—is the Spectrum Center, a venue that hosts concerts and sporting events, with 176 mentions (36.4 percent of total mentions in the census tract). Overall, approximately one-third of tracts (or sixty-three) are highly skewed toward one particular location. When represented on a map (Figure 17), one sees that location mentions in all articles cluster in Center City and other neighborhoods, such as University City South, that contain the airport, hospitals, or event venues.
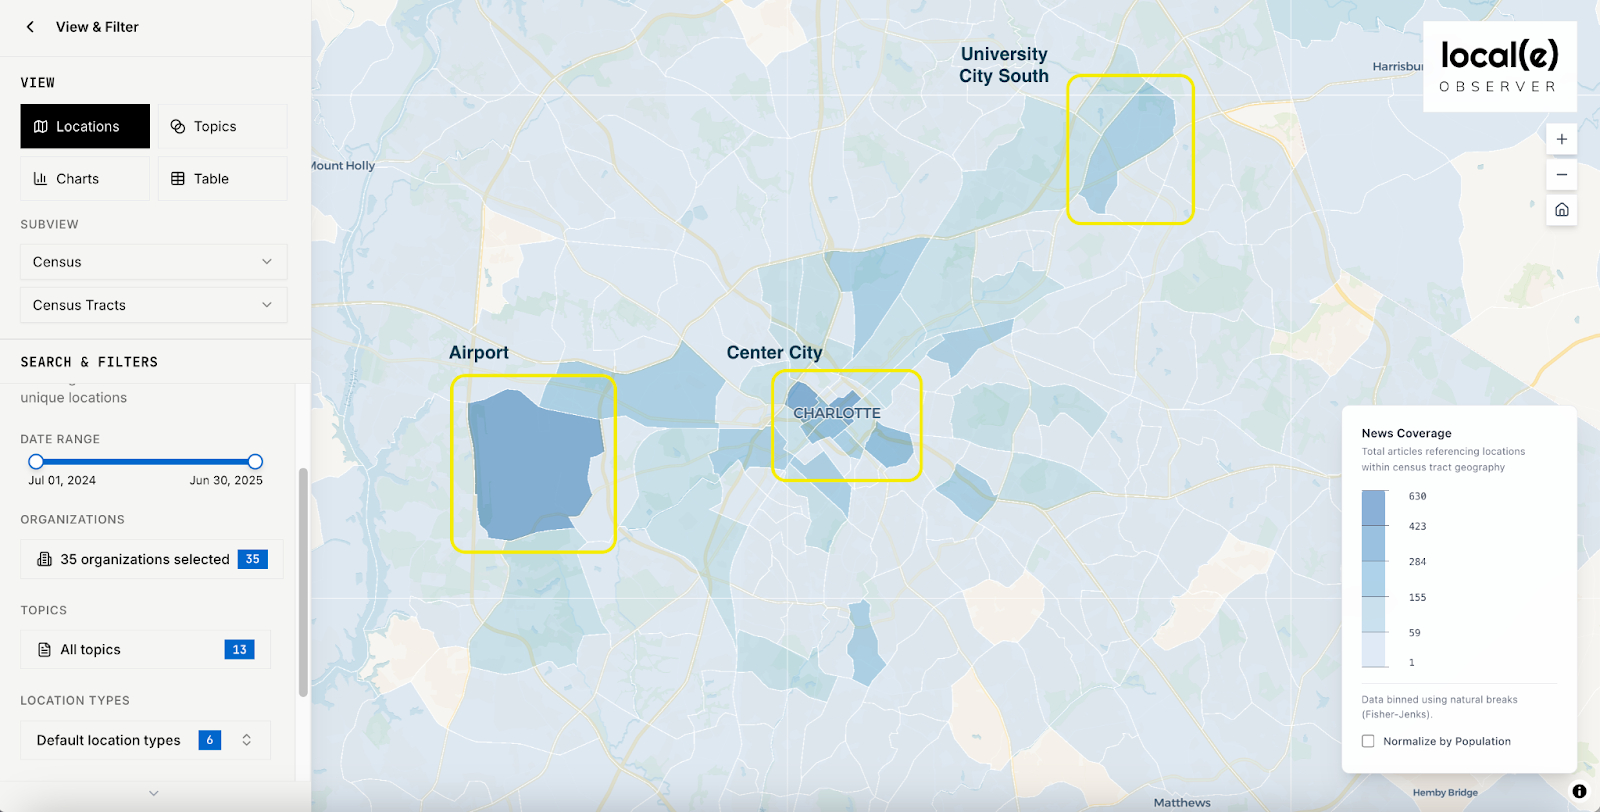
Figure 17: Neighborhoods with large sports and concert venues or hospitals are mentioned often in local news coverage.
On one hand this makes sense; local news is often event-based—whether the event is a football game, a concert, or a shooting. Media theorist Shanto Iyengar called this tendency for local news to focus on events “episodic framing,” and contrasted it with thematic framing, which puts events in their broader socioeconomic context. Thematic framing is more likely to identify the structural forces behind local developments, but requires more time and resources to produce.34[34] S. Iyengar, Is Anyone Responsible? How Television Frames Political Issues, (The University of Chicago Press, 1991). Local news stories framed thematically are also, clearly, less likely to be detected by a geotagging tool. We have several ideas about how to iterate on our model to capture more thematically framed stories in the future.
At the other end of the spectrum, fifty-two census tracts received ten or fewer mentions (in 556 articles). Our analysis shows that the majority of coverage these neighborhoods received focused on crime: 319 of the articles (57 percent) were about crime, while just twenty-five (4 percent) were about entertainment.35[35] We defined crime articles as those about discrete unlawful acts (e.g., shootings, assaults, robberies, fraud, arson) and entertainment articles as those about events such as concerts, theater productions, and gallery openings, as well as some cultural fare such as movie reviews and a new app for exploring local parks, for example. This contrast is instructive because it illuminates the choices outlets make in terms of coverage, given that in most communities there are events and celebrations to highlight in addition to crime.
Quality of Coverage: Crime vs. Entertainment
We were curious about how the balance of crime versus entertainment coverage would relate to neighborhoods’ structural characteristics, such as racial makeup. So we looked more closely—and through a statistical lens—at whether structural characteristics predicted the proportion of crime and entertainment coverage across census tracts.
We found that population size and racial composition together accounted for 23.1 percent of the variance in crime coverage36[36] (R2 = 0.231, F(2,165) = 24.8, p < 0.001), while the same factors accounted for 18.5 percent of the variance in entertainment coverage.37[37] (R2 = 0.185, F(2,165) = 18.8, p < 0.001) In other words, we found that race and population are significant—and inverse—predictors of coverage type: the percentage of white residents was negatively associated with crime coverage38[38] (𝛽=-0.31, SE = 0.06, p<0.001) and positively associated with entertainment coverage.39[39] (𝛽=0.12, SE=0.03, p<0.001) In practical terms, for each 10 percentage point increase in a census tract’s white population, we would anticipate a 3.5 percent decrease in crime coverage and a 1.2 percent increase in entertainment coverage.
The regression models suggest that while both race and population significantly covary with crime and entertainment coverage, race is more closely linked to both topics at the neighborhood level. To display this correlation visually, we plot the census tract race data compared with the number of articles about crime or entertainment in Figure 18.
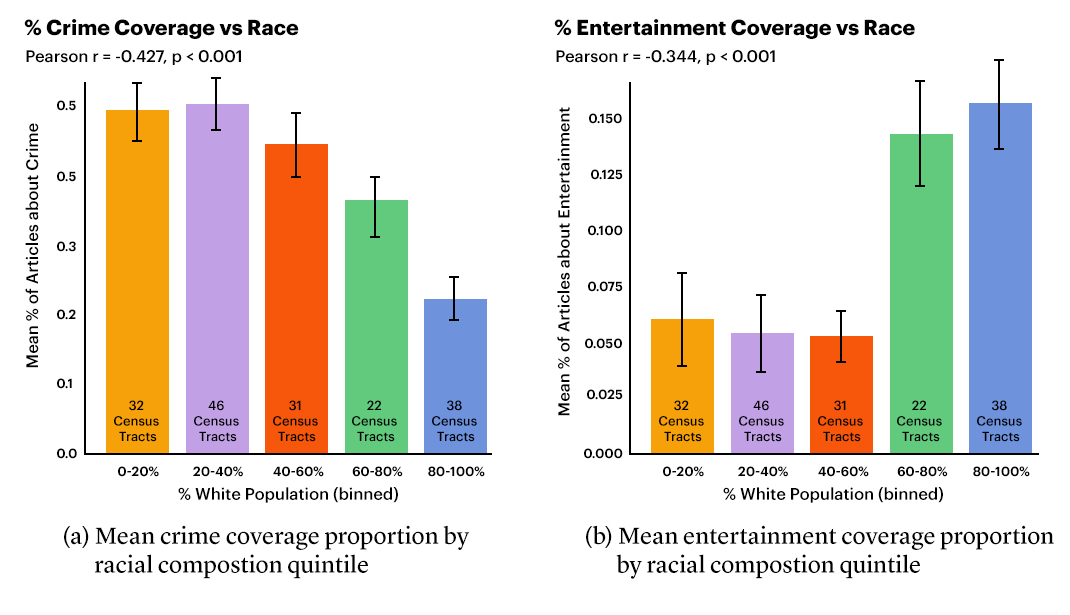
Figure 18: Crime and entertainment coverage as they relate to the racial composition of census tracts.
The census tracts are binned by percentages of racial distribution to more intuitively deduce trends. Crime coverage (left) decreases fairly linearly as the percentage of white residents increases, while entertainment coverage (right) is less linearly distributed, with a marked jump for neighborhoods whose white population constitutes 60 percent or more of the total. These correlations suggest that crime coverage in particular is linked to racial makeup.
Coverage Patterns by Outlet
The mapping tool also sheds light on the geographic coverage areas of individual outlets or outlets oriented toward different audiences. We looked at the coverage areas for three outlets that are oriented toward more affluent Charlotteans—Axios Charlotte, tiny money, and (the now defunct) Charlotte Magazine. While these outlets offer different types of stories—Axios does more “hard news” about policy and politics, tiny money focuses on lifestyle, and Charlotte Magazine covered culture broadly—their target audiences share a certain level of disposable income. Figure 19 shows that the coverage areas for these three outlets concentrate primarily in the southern “wedge” portion of Charlotte.
Figure 19: Coverage by Axios Charlotte, Charlotte Magazine, and tiny money is concentrated largely in the southern “wedge” section of Charlotte.
A sample of stories by these outlets covering Charlotte’s lower-income “crescent” includes one by Axios titled “Is Charlotte becoming unsafe? We asked the top 3 local law enforcement officers” and, in Charlotte Magazine, “Restoring Charlotte’s ‘Black Wall Street’” (see Figures 20 and 21, below).
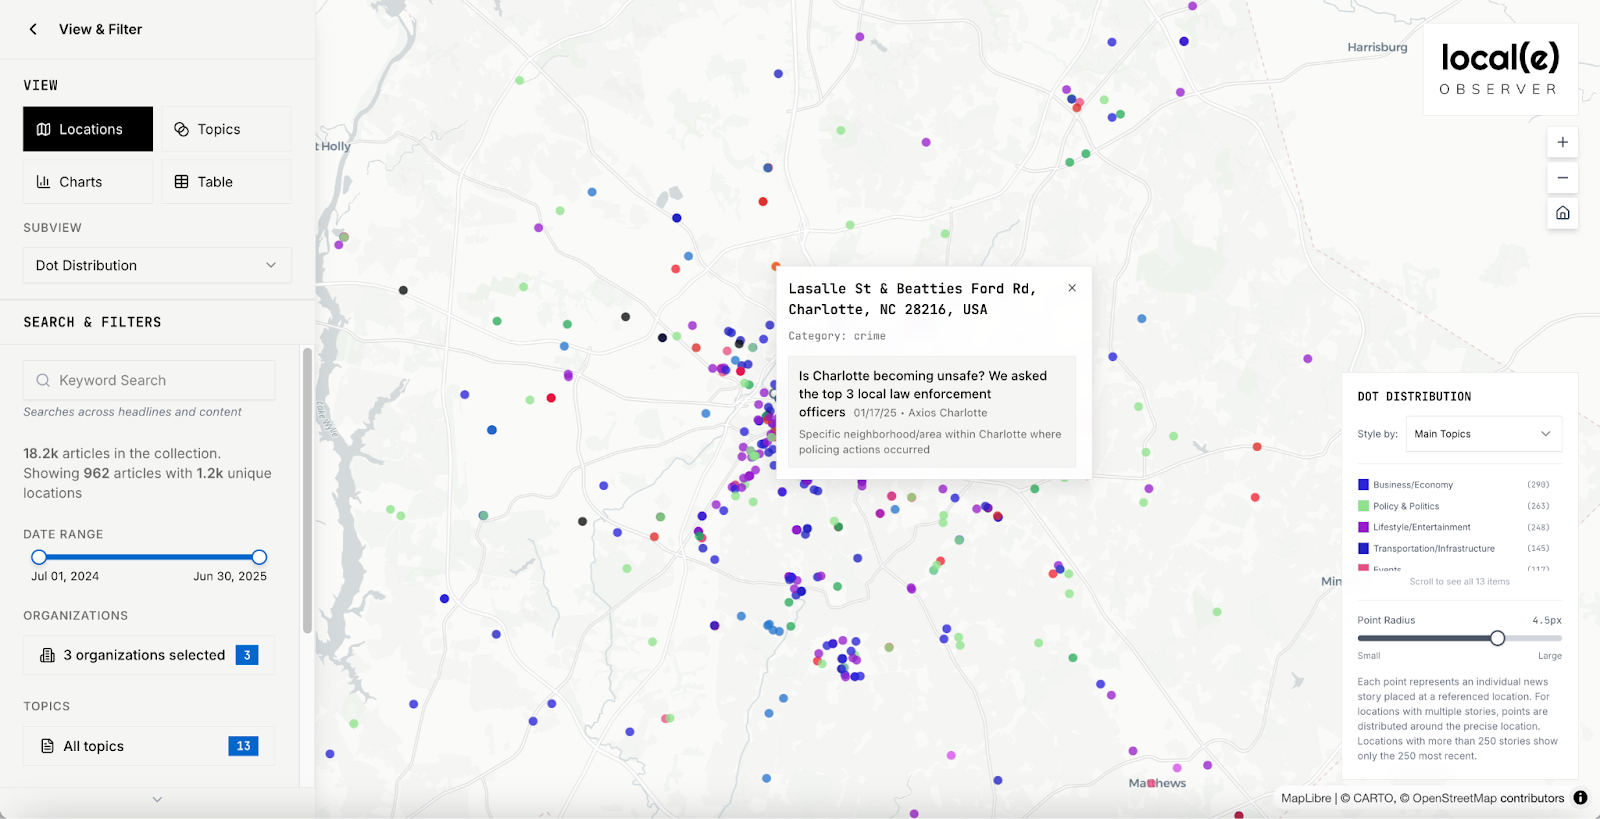
Figure 20: An Axios story covering a “crescent” neighborhood focuses on crime (the dot at the upper left of the tooltip marks the article’s location).
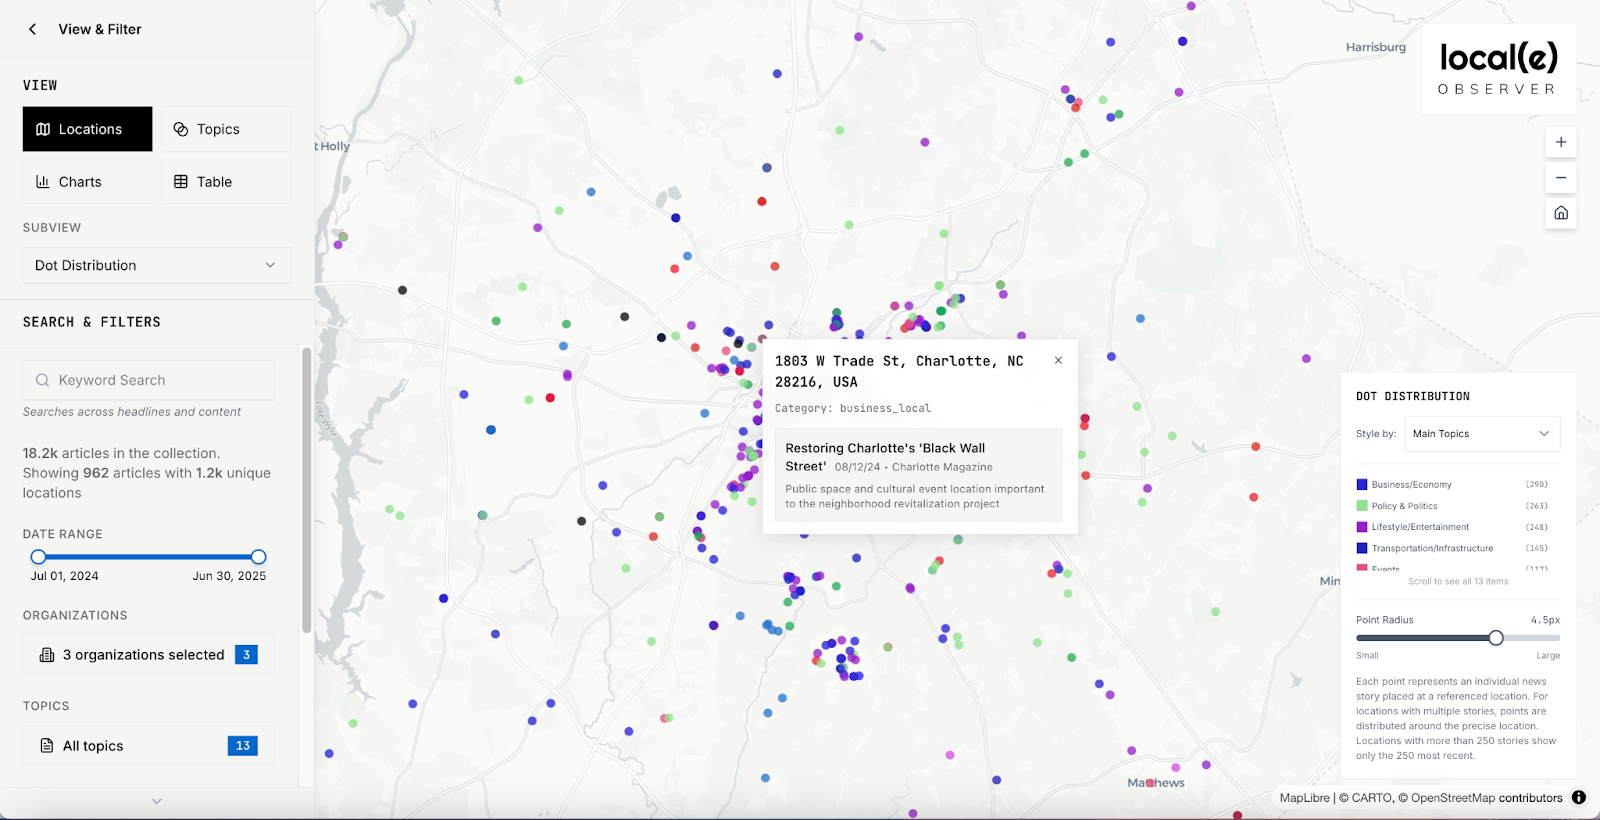
Figure 21: A Charlotte Magazine story anchored in the “crescent” portion of Charlotte focuses on neighborhood revitalization.
Figure 22 shows locations mentioned in stories from two outlets serving primarily Black communities—QCity Metro and the Charlotte Post.
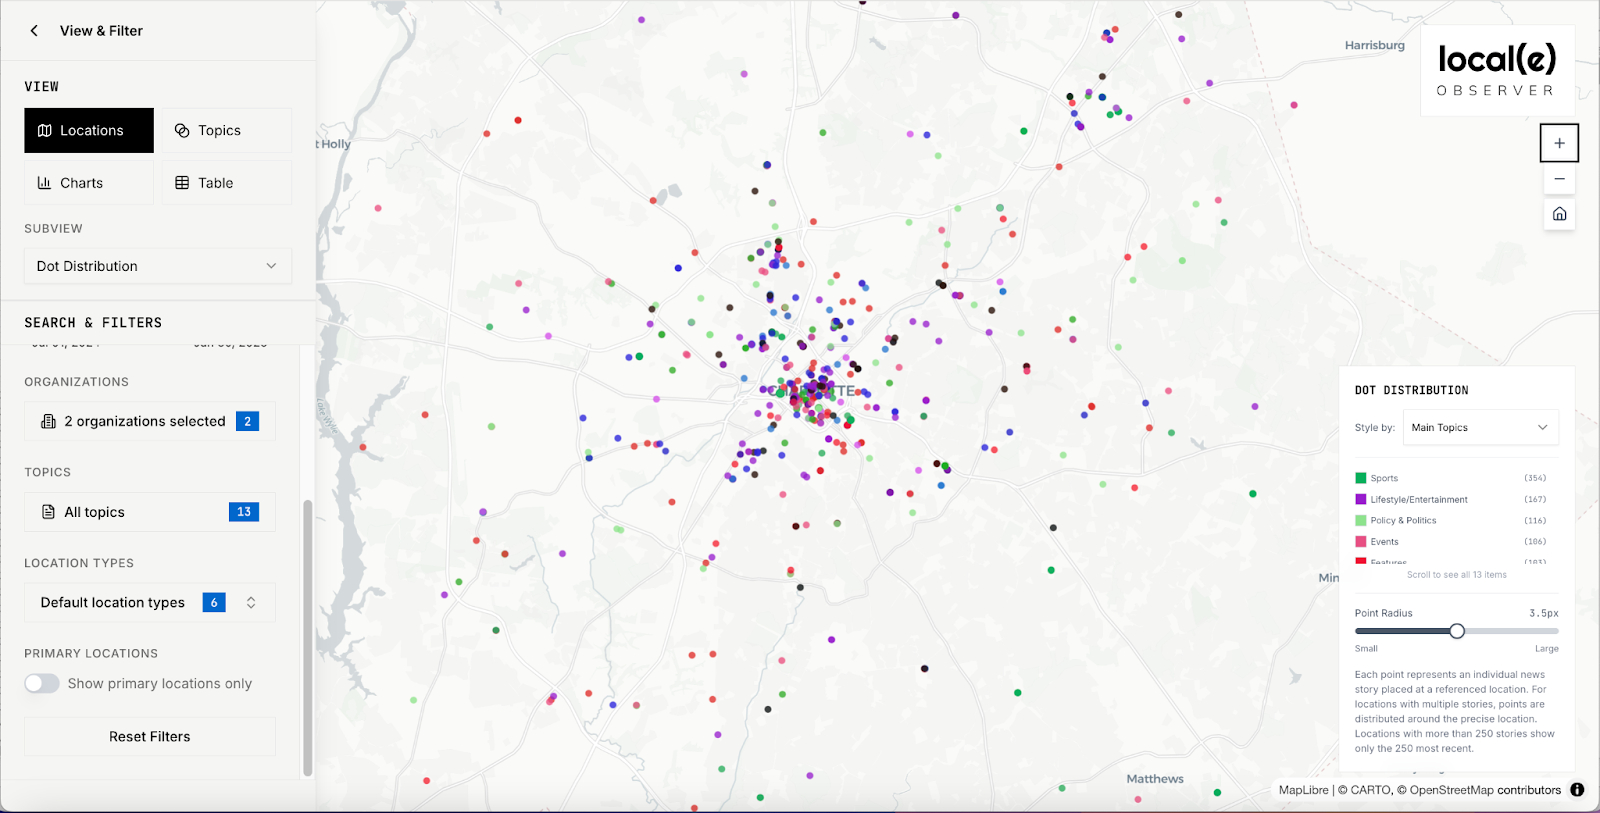
Figure 22: Coverage areas of QCity Metro and the Charlotte Post are anchored in Center City and the surrounding “crescent” neighborhoods.
The distribution of articles in these publications is more evenly spread from Center City outward, especially in crescent neighborhoods in the north and northeast of the city.
Many more analyses can be made regarding coverage patterns and quality of coverage as they relate to structural characteristics of communities. For example, an additional feature of the map is a longitudinal tool that shows how coverage changes over time; this could be useful for exploring how outlets covered a major event like an election or for comparing coverage before and after an outlet receives an infusion of resources.
Charlotte Civil Society Organizations as Local Civic Communicators
One of the innovations of this research is the inclusion of CSOs as local information providers; however, we posit this role as a hypothesis rather than a statement of fact. In the face of local news deserts, do nonprofits, local government, houses of worship, schools, and advocacy groups provide critical information that is not being provided by local news outlets?
To begin to answer this question, we created a CSO census similar to the local news provider census—with attention to CSOs that are known to participate in Charlotte’s public sphere.40[40] See, e.g., charlottejournalism.org/wp-content/uploads/2025/05/2025-Summit-Attending-Organizations.pdf The caveat is that this research tracks online CSO communication only. This is important to acknowledge because it is possible that there are other CSOs that fill information gaps, especially in news deserts, but do so largely offline, by word of mouth or through printed fliers and newsletters. Nevertheless, our analysis is a step toward discovering the role these organizations can play in local news and information landscapes.
Charlotte is served by at least seven hundred civil society organizations (CSOs), defined here as a nonprofit entity whose mission is to serve a cause or community or to advance a civic-minded interest or goal.41[41] See, e.g., “UNRIC Library Backgrounder: Civil Society,” United Nations Regional Information Centre for Western Europe, n.d. Accessed at unric.org/en/unric-library-backgrounder-civil-society/#:~:text=PDF,Relations%20(Glossary%2C%20page%2013) This definition is intentionally broad enough to include not only nonprofits and NGOs, which are often included in this category, but also local government and business bureaus; houses of worship including churches, temples, and synagogues; and schools and universities, whether public or private. The main types of organizations not counted in this analysis are for-profit businesses and corporations, because their aims are, by definition, to benefit themselves and their shareholders, rather than some community or broader public good. That said, many large corporations have foundations that contribute generously to their local news ecosystems, as is the case in Charlotte.
We are by no means the first to highlight the role of CSOs in local civic information landscapes.42[42] See, e.g.: Listening Post Collective, https://listeningpostcollective.org/iea-3/; F. Morgan, “Learning from North Carolina,” 2017; Roadmap for Local News, localnewsroadmap.org/ When local news and mapping studies overlook these sources, it is usually because they require more time and resources to capture. But the reasons for including them are compelling: people who live outside easy geographic reach of news outlets or do not have enough disposable income to be desirable to advertisers can become invisible. Yet those communities have information needs, and in many cases, civil society organizations are working there and communicating with them regularly.43[43] See S. Stonbely, “From ‘News Deserts’ to ‘Information Oceans’?” Columbia Journalism Review, Dec. 19, 2024.
Two organizations track Charlotte’s nonprofit sector: SHARE Charlotte and the North Carolina Center for Nonprofits. Both have searchable online catalogues. There are between seven hundred and twenty-five hundred nonprofits serving the greater Charlotte area, depending on which organization’s count one uses and where the city’s geographic boundary is drawn. We catalogued detailed information for five hundred and twenty-six CSOs, including nonprofits, houses of worship, schools, and universities (the full list of CSOs we analyzed is available upon request).
How Do Charlotte CSOs Communicate with Their Audiences?
We wanted to know how Charlotte CSOs communicate with their constituents and whether their communications fill gaps left by local news outlets. To answer these questions, we first conducted a census similar to the one we undertook for local news outlets. We gathered information on multiple variables, including primary focus area, community/ies served, type of organization, distribution channels for communications, and linked organizations, be they funders, local news outlets, or other CSOs. Though we did not log all CSOs serving Charlotte, the goal was to achieve a diverse sample from which we could confidently generalize. In addition, we analyzed the content from a small subset of twenty CSOs, which we modeled and mapped for direct comparison with news outlets.
Charlotte CSOs’ Digital Communication Presence
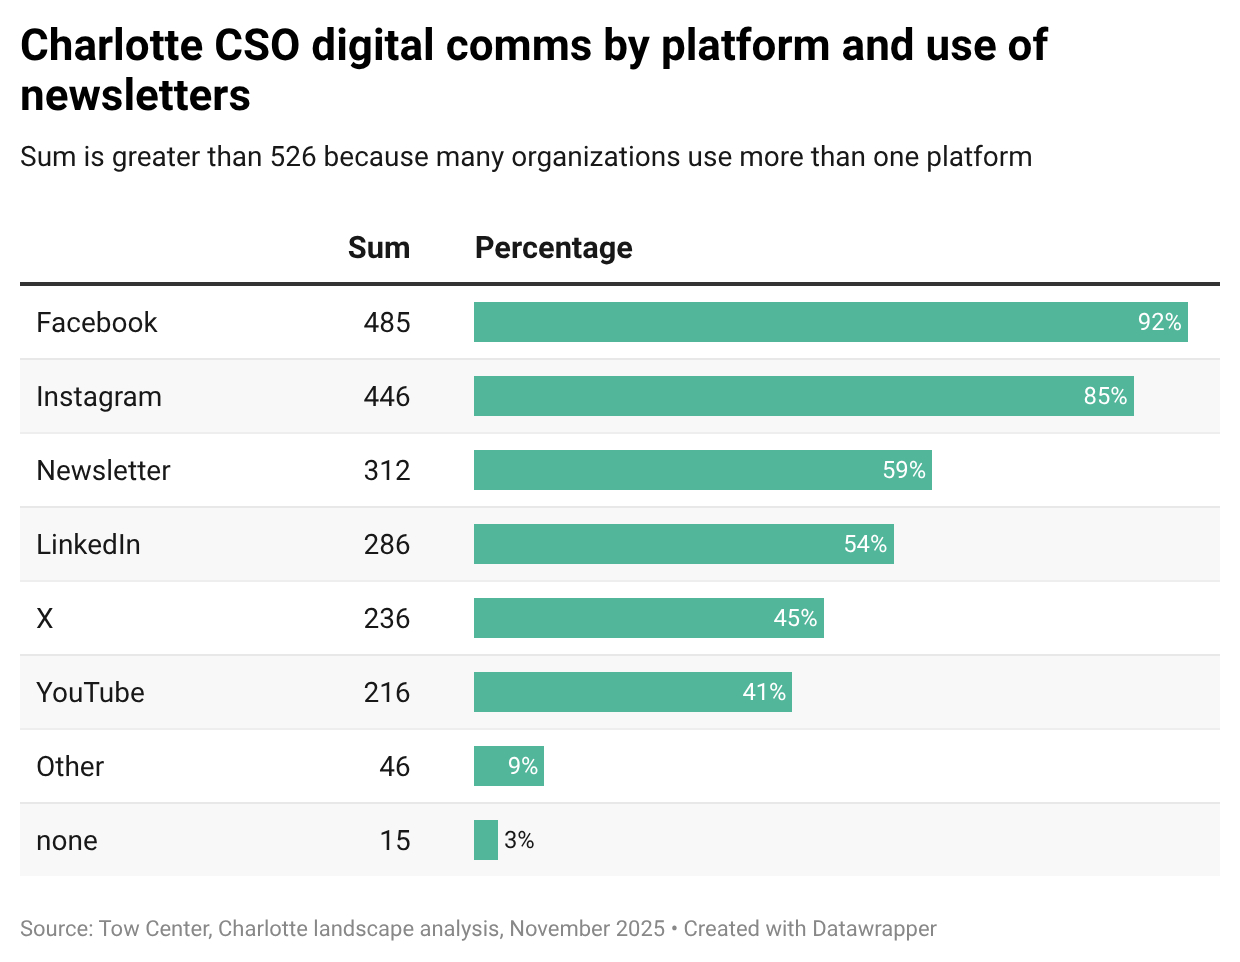
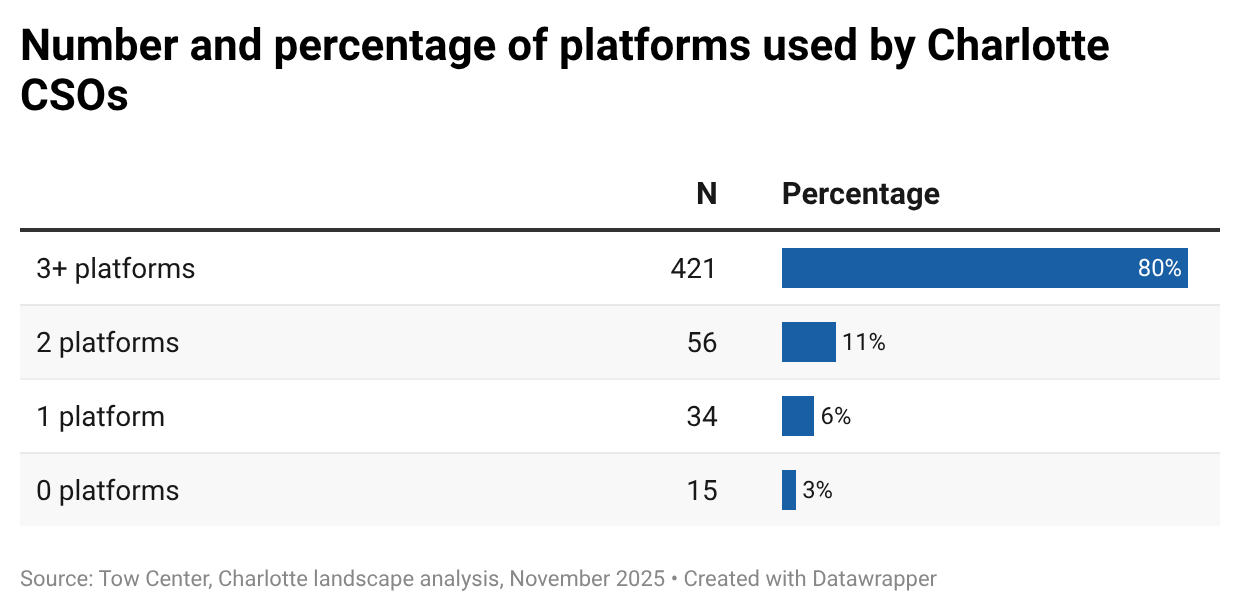
We looked at each CSO’s presence on social media, and whether it has a newsletter. The most commonly used social media platform for the CSOs in our sample was Facebook, which is used by four hundred and eighty-five organizations (92 percent), followed closely by Instagram, which is used by four hundred and forty-six organizations, or 85 percent. Table 2 below shows the prevalence of use for all platforms. Notably, more than half use email newsletters, and only fifteen, or 3 percent of our sample, use no digital communications at all.
Table 2: Charlotte CSO digital comms by platform and use of newsletters. (Note: the sum is greater than five hundred and twenty-six because many organizations use more than one platform.)
Overall, the Charlotte-serving CSOs in our sample make good use of digital communication via social media. We found that 80 percent of organizations are on three or more platforms, meaning that most are very active in their outreach and meeting people where they are (Table 3).
Table 3: Number and percentage of platforms used by Charlotte CSOs
We were further able to gather data on engagement for all organizations—news outlets and CSOs—on Facebook. The top hundred organizations in terms of engagement included twenty news outlets and eighty CSOs. Thirteen news organizations were in the top twenty in terms of “likes,” four of which made the top five (WCNC, WSOC, WBTV, and Queen City News, affiliated with WJZY).
Do Charlotte CSOs Fill Content Gaps?
We hypothesized at the beginning of this project that civil society organizations might fill information gaps left by news outlets. We sought to answer this question in a few ways. First, we analyzed the semantic map for topics that are mostly or only covered by CSOs (to do this, we selected only the news organizations in the “Organizations” filter, then looked for areas with gray dots). Figure 23 below shows a number of gray dots—representing stories not selected—in the middle-right quadrant.
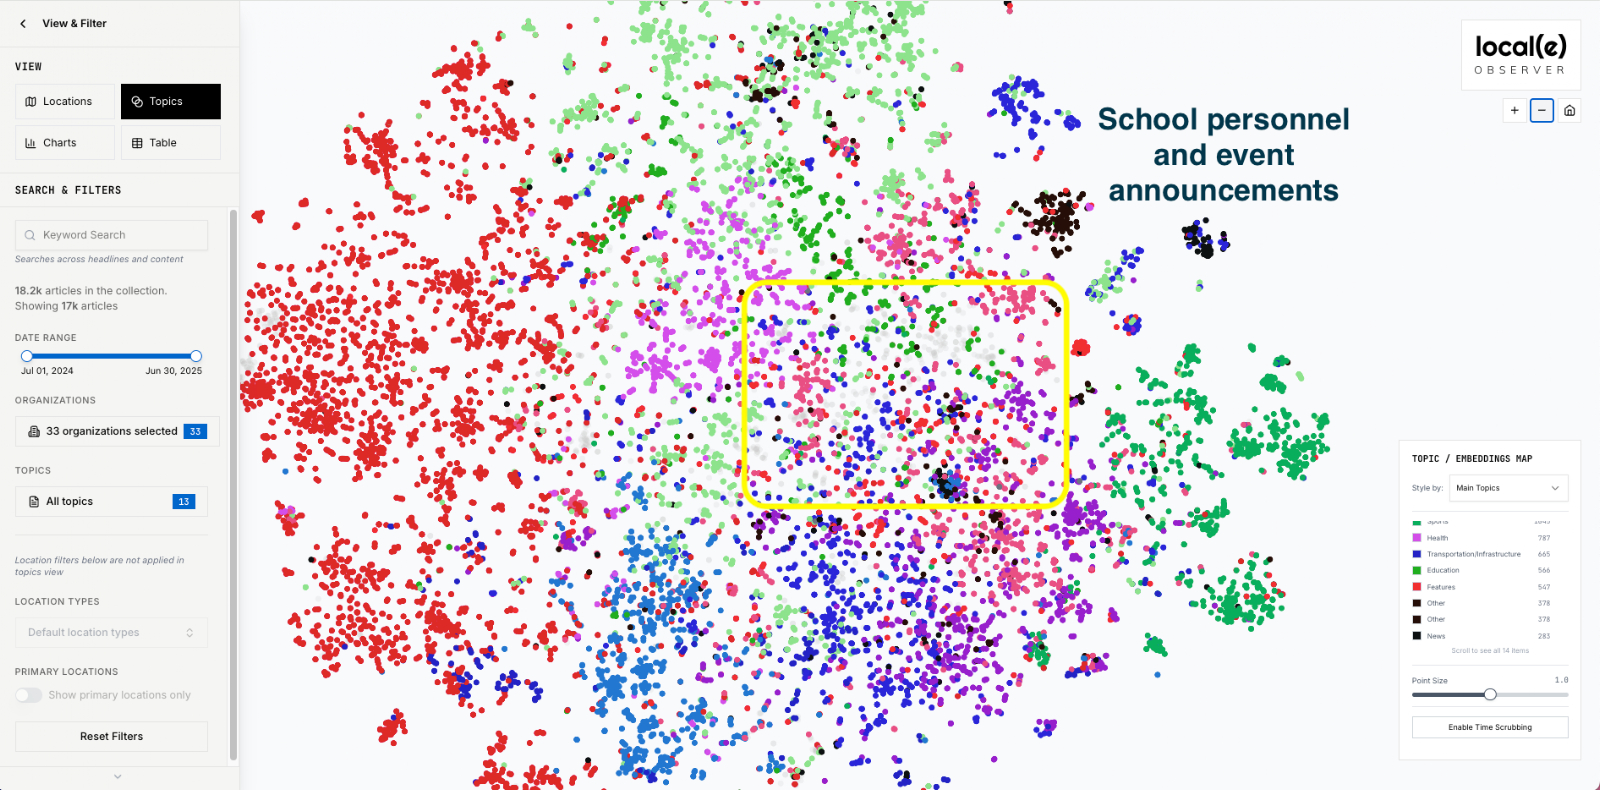
Figure 23: News outlets tended not to cover school personnel and event announcements.
While many of these “stories” in our sample were press releases from schools (Charlotte Country Day School and Charlotte-Mecklenburg Schools), some of that content would presumably be of interest to the many parents who have school-age children in Charlotte. For example, one story from the Charlotte-Mecklenburg Schools is about seventy-three educators throughout the system who received their National Board Certification; another, from Charlotte Country Day, is about the dedication of its stadium to a longtime lacrosse coach.
Other stories that appear not to have been covered by local news outlets but were covered by CSOs focused on firehouses and public safety. Figure 24 shows this news gap.
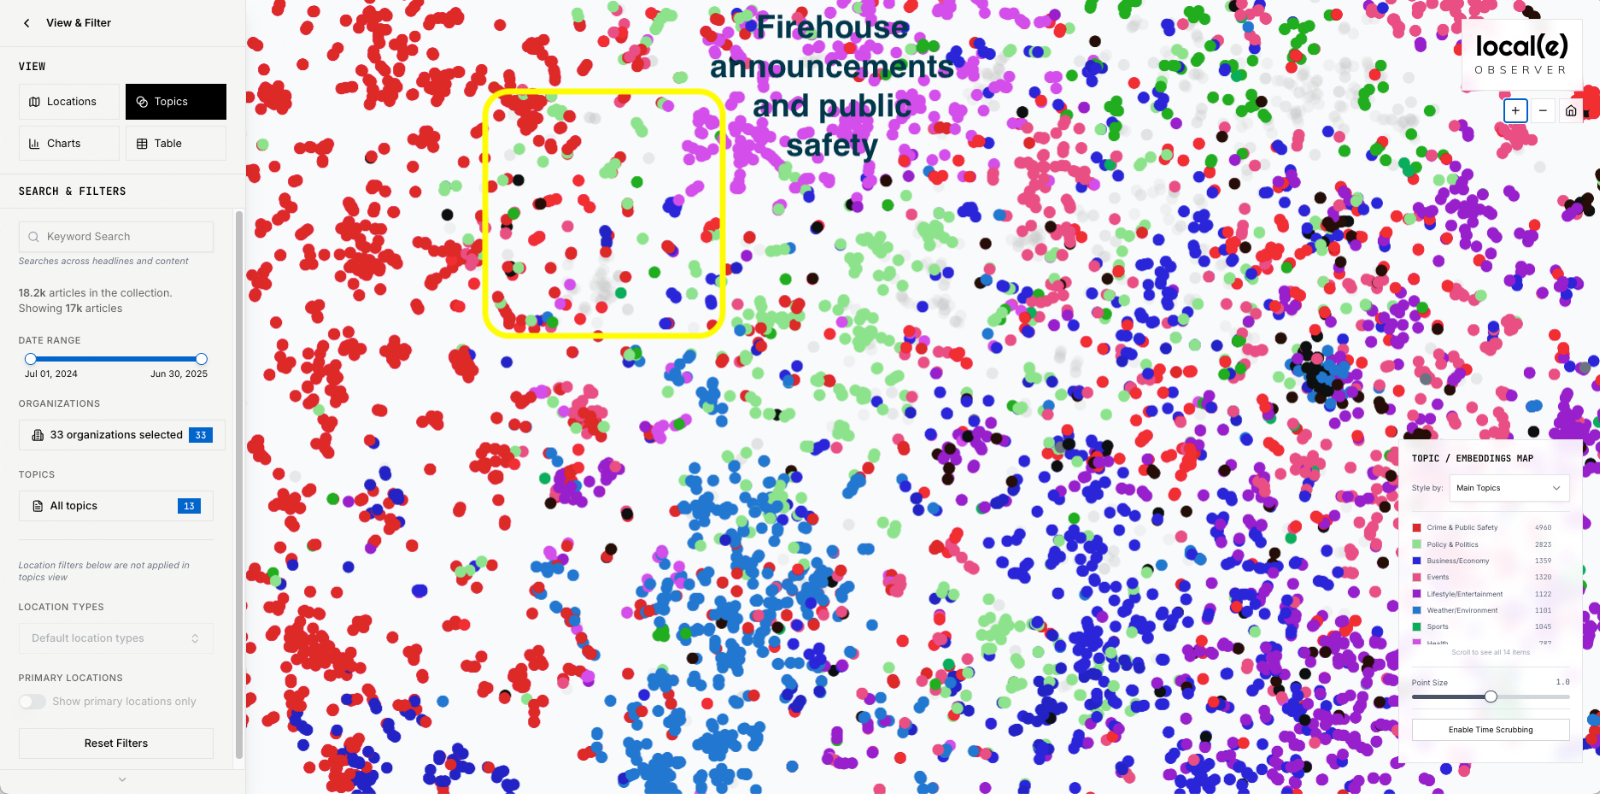
Figure 24: A news gap around coverage of firehouses and public safety.
These communications—mostly from the City of Charlotte, but also from the Centralina Regional Council and University City Partners—contain information about the Charlotte firefighting force that is presumably of interest to all Charlotteans. For example, one piece of content details the expansion of the force to include a new battalion; another talks about a new field technician role that aims to bring the latest firefighting technology to Charlotte. Others focus on women or long-serving members of the fire department. A public safety release from University City Partners discusses the efforts that CSO has undertaken to make quality-of-life improvements in its part of town (see Figure 25, below).
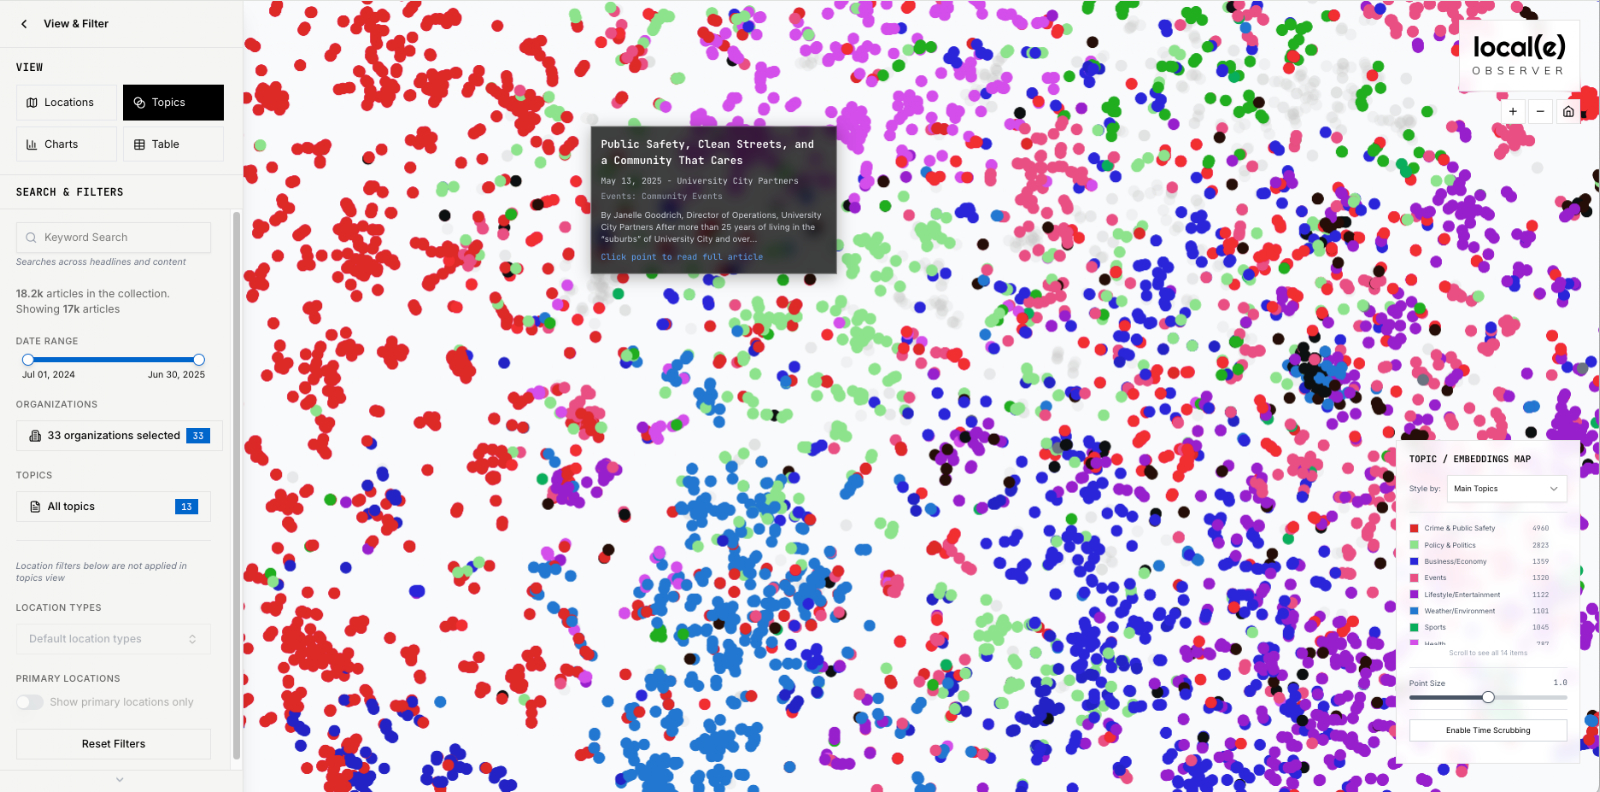
Figure 25: A CSO write-up filling a local news gap.
One can see how this tool helps uncover topics that CSOs are highlighting but local news outlets are not. We believe the relatively small number of gray dots on our current semantic map reflects how the sample was constructed rather than conditions on the ground. In other words, because we aimed to capture more local news than CSO content, this map likely shows less CSO content than actually exists.
Of course, local news outlets often work with CSOs and make good use of the public content they provide. Figure 26 shows the same semantic map with only stories from the CSOs in our sample highlighted.
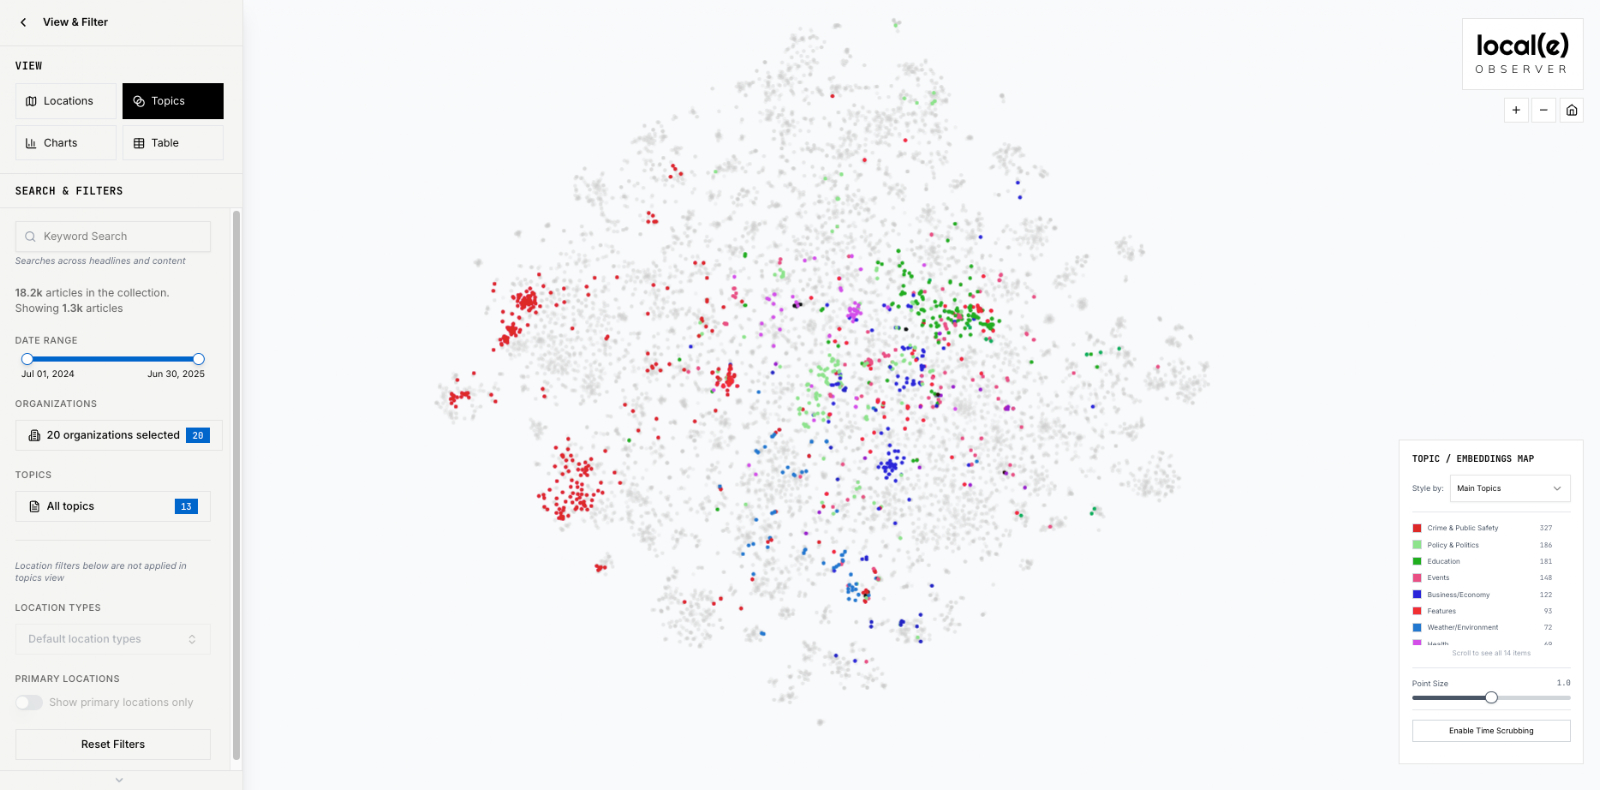
Figure 26: Stories by CSOs only.
Most of the dots here overlap with stories by news outlets, showing the extent to which they cover similar topics. Another way to see this is in Table 4 (below), which shows the number and share of stories or communications on various topics by news organizations versus CSOs.
Table 4: Topic coverage by news outlets versus CSOs
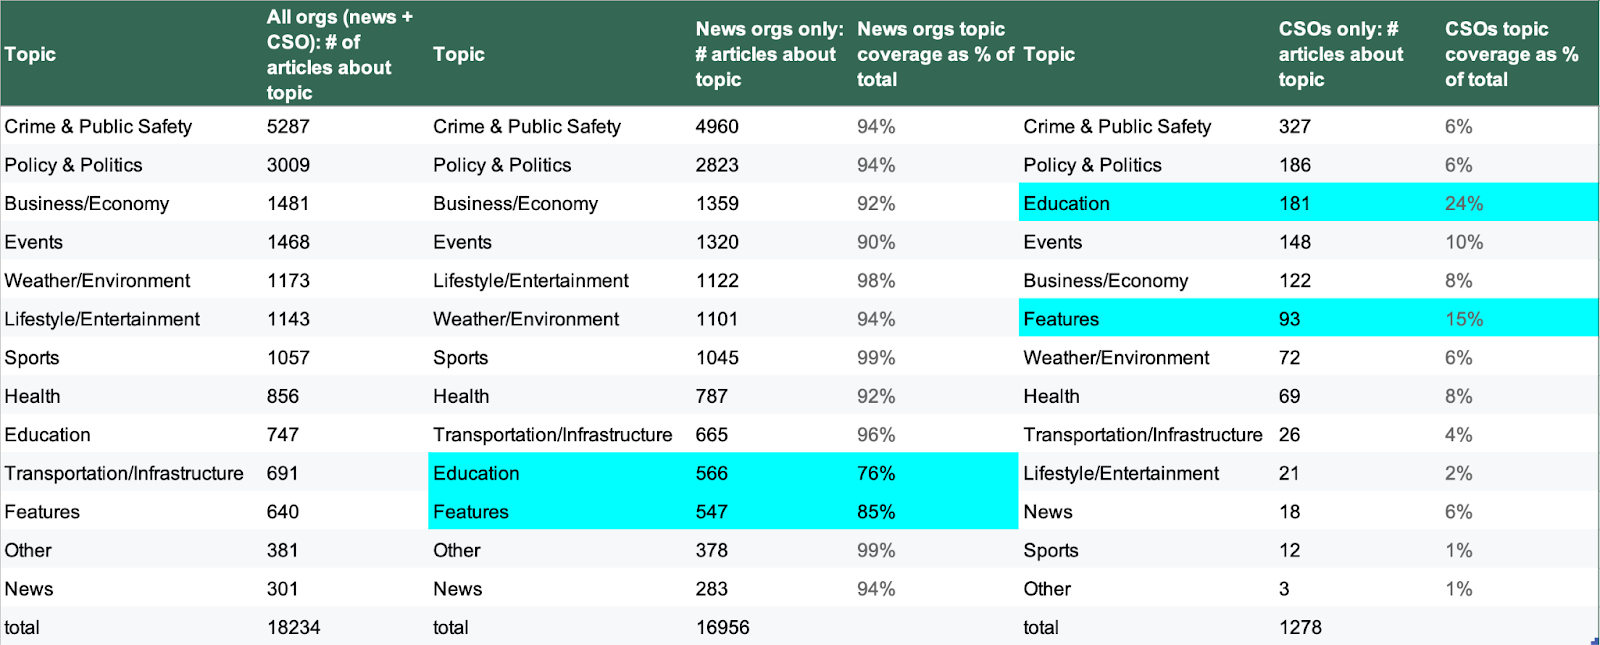
Here one sees the disparity in terms of the total number of pieces of content in the sample, a function of the fact that CSOs inherently produce less content than news outlets, and that news organizations outnumbered CSOs in our sample. After accounting for that disparity, one sees what we saw in the semantic map—that the CSOs here produced a greater number of stories about education and more feature-type communications relative to their other content.
Conclusion
In this paper we have demonstrated the possibilities of a new method for understanding local news and information landscapes. Using Charlotte as a test case, we showed the capabilities of two tools: a semantic map and a coverage map. In addition, we broadened the scope of “what counts” as local news and information to include civil society organizations like schools, local government, and community nonprofits. When coupled with the standard news outlet census, this methodology offers unparalleled visibility into a local mediascape.
Overall, we collected and analyzed more than eighteen thousand pieces of content from local news and community organizations. We analyzed them for topics (e.g., education, crime, etc.) and location mentions, to see which parts of the city were being covered, and how.
In Charlotte, Center City receives by far the most coverage, owing to the large sports and entertainment venues located there. The census tract that is home to the airport also receives a disproportionate number of mentions. University City South and Dilworth likewise receive significant coverage. In Dilworth, many crime victims are treated at the Atrium Health Carolinas Medical Center, resulting in disproportionate coverage. The semantic map revealed topics that are uniquely covered by niche outlets, showing the value of a diverse local news ecosystem, and highlighted topics that CSOs are talking about but news outlets are not.
In addition, we found that predominantly Black neighborhoods are more likely to be covered in the context of crime, while predominantly white neighborhoods are more likely to be covered in the context of entertainment.
How can funders and publishers best use these tools? Funders can now see both the topical and geographic coverage of any local publisher, giving them visibility into exactly which neighborhoods are being covered and precisely which topics are being written about. They can also compare publishers to others in the field, and to civil society organizations with which they might collaborate. This tool can also capture change over time, allowing for before-and-after testing or monitoring coverage pre- and post-intervention.
Publishers can gain unprecedented insights into their own coverage, allowing them to find and fill reporting gaps by covering certain neighborhoods or topics more rigorously. They can also see how their coverage has changed over time and monitor whether the changes they’ve implemented have resulted in desired advances in coverage. In addition, for the purposes of advertising, impact reports, and grant applications, publishers can now easily visualize where and how their coverage is unique. They can also see others—news outlets or CSOs—that are covering similar neighborhoods or topics, and propose collaborations.
In terms of the tools and methodology, this study has revealed several things we would like to iterate on or improve:
- In addition to including salubrious civic news and information providers, make a concerted effort to include malicious actors in the local mediascape, such as pink-slime outlets and social media rumor mills, where they exist.
- Tweak the topic modeling so that fewer stories are classified as “other” and sharpen the definition of topics such as “infrastructure.”
- Identify local neighborhoods such as the Historic West End and other local landmarks not tied to a specific address ahead of data collection, allowing these locations to be geotagged.
- Look for commonalities among stories not captured by geotagging to find other ways of tracking them (e.g., vis-à-vis episodic vs. thematic framing).
- Create a more even mix of CSOs and local news outlets, accounting for the fact that CSOs inherently produce less content than local news providers.
- Identify non-English-speaking communities early and conduct outreach to identify local news and community organizations that provide them with critical information.
- To the extent possible, identify important local events ahead of time (e.g., elections), and conduct data capture before and after to allow for longitudinal analysis.
Recommendations for Funders
- A few outlets (e.g., the Charlotte Post) do a good job of covering predominantly Black neighborhoods in contexts other than crime. Other outlets should be incentivized to do the same.
- Given the success of the Charlotte Journalism Collaborative, incentivize similar collaborations elsewhere.
- Begin conversations with local publishers about how to handle AI aggregators and/or approach AI platforms.
- Conduct follow-up research looking specifically at the business models of the outlets identified here, along with an analysis of conditions that contribute to success.
Appendix A: Comparison of Charlotte local news landscape studies
Other studies have looked at Charlotte’s local news and information landscape. Below, we compare the findings of three such studies, two of which were conducted in 2025, and one in 2023. All include valuable elements and methods. Because the news and information landscape changes quickly, they are reviewed in reverse chronological order, beginning with the most recent.
Local News & Information: Historic West End
June 2025 (draft)
By: UNC Charlotte Urban Institute
Prepared for: Knight Foundation
Public version not yet available
This study focuses on one part of the City of Charlotte: the Historic West End. As its name implies, the Historic West End is composed of a number of historically significant Black and African American neighborhoods located west and northwest of Center City. The methodology consists of surveys, interviews, and community input during the research design phase. The researchers gathered data about information needs and most trusted local sources of news and information. The largest percentage of respondents identified local TV news as their top source for local news, followed by online-only sources, radio stations, outlets oriented toward ethnic or nonwhite communities, and, lastly, daily newspapers. The alphabetical list of outlets identified by study participants, as they are listed in the report, is as follows (all except the County News, which is now defunct, are also included here):
• Axios
• Charlotte Business Journal
• Charlotte Observer
• Newsbreak
• Power 98 (WPEG 97.9 FM)
• Pride Magazine
• QCity Metro
• Queen City Nerve
• Queen City News (the website of local TV station WJZY)
• Spectrum News
• Charlotte Post
• The County News
• WBTV
• WBT
• WCCB
• WCNC
• WFAE/NPR
• WSOC-TV/ABC
The State of Local News 2025
October 2025
By: Tim Franklin, Zach Metzger, Srishti Bose, John Volk, et al.
Local News Initiative, Medill School of Journalism at Northwestern University
Available at: localnewsinitiative.northwestern.edu/projects/state-of-local-news/2025/
North Carolina page: localnewsinitiative.northwestern.edu/projects/state-of-local-news/explore/#/state-localnewslandscape?state=NC&stateCode=37
This national study identifies local news outlets across the country, mapping at the county level. It maps outlets by the location of their newsrooms and relies primarily on lists of outlets from the fifty state press associations. In recent years it has added ethnic media, digital-native outlets, and public broadcasters. Medill’s parameters for inclusion are stricter than the ones we employed, but align closely with what we are calling “local journalism originators.”
For Mecklenburg County, in which Charlotte is the largest city and the county seat, the Medill study counts twenty-one local news outlets (listed below). It erroneously includes four ethnic outlets that serve different counties (including three versions of La Noticia that have the names of the other counties or cities in their name, e.g., La Noticia Raleigh). Further, commercial radio station La Latina 102.3FM is licensed and based in Charlotte but does not provide local news—either on air or on its website. WHEH Aztec America 41 seems to refer to WHEH-LD, which was an affiliate of Azteca America, but ceased operating in 2023. Those outlets are struck through below.
The Medill report also identifies thirteen Charlotte-based (and -serving) outlets—indicated in bold. Our list includes these thirteen, as well as nineteen more local journalism originators. So while the Medill report appears to be overcounting ethnic outlets, it misses many others.
- Matthews-Mint Hill Weekly
- South Charlotte Weekly
- Lake Norman Citizen
- Charlotte Observer
- Queen City Nerve
- Qnotes
- Charlotte Ledger
- Axios Charlotte
- Charlotte Post
- Estrella TV 16.1
Hola News(Triad)La Latina 102.3 FMLa Noticia Asheville- La Noticia Charlotte
La NoticiaGreensboro, Winston-Salem, High Point areaLa Noticia Raleigh- QCity Metro
- Telemundo Charlotte
WHEH Aztec América 41- WFAE
- WTVI
Healthy News & Information Ecosystems 2023
2023
By: Impact Architects
This report provides an overview of the news and information landscapes of eight “Knight Communities,” five of which Impact Architects previously examined in 2020, including Charlotte. The local news provider census focuses on journalism outlets and draws from INN and LION’s member indexes, as well as the New York Times local news database. It also includes ethnic and nonwhite media.
The local news census surfaced thirty-six outlets in total, “an increase of two since 2020 (Queen City Nerve and the Charlotte Voice44[44] The Charlotte Voice appears to have shut down in November of 2023, as its last Instagram post was dated Nov. 7, 2023.), suggesting there was growth in some areas of Charlotte’s news and information ecosystem with new organizations cropping up and some even expanding,” according to the report. Queen City Nerve is the successor to Creative Loafing, which closed in 2018 but was still on Impact Architect’s list (struck through below). Our list includes all outlets captured by Impact Architects, except for Creative Loafing (defunct), the Charlotte Voice (defunct), the Denver Citizen, the Lake Norman Citizen, and Matthews-Mint Hill Weekly, which all serve areas outside Charlotte, and EdNC, a statewide publication.
Axios Charlotte
Catholic News and Herald
Charlotte Business Journal
Charlotte Ledger
Charlotte Magazine
Charlotte Observer
Charlotte Post
Charlotte Voice
Creative Loafing
Denver Citizen
EdNC
El Progreso Hispano
Enlace Latino
Hola News Charlotte
La Noticia
Lake Norman Citizen
Matthews Mint Hill Weekly
Mecklenburg Times
Mundo Latino Newspaper
PBS Charlotte
Pride Magazine
Q City Metro
Q Notes
Que Pasa Mi Gente Charlotte
Queen City Nerve
South Charlotte Weekly
Spectrum News 1
Telemundo
WBT
WBTV
WCCB
WCNC
WFAE
WJZY
WSOC-TV
Appendix B: Methods
Data Collection
Our first step in collecting data was to obtain all recent studies that have identified local news outlets in North Carolina or Charlotte specifically.45[45] These included: data shared by Jessica Mahone, then at UNC’s Center for Innovation and Sustainability in Local Media; Impact Architects’ “Healthy News & Information Ecosystems 2023”; Medill Local News Initiative, “The State of Local News 2025”; and Muck Rack/Rebuild Local News, “Local Journalist Index 2025.” We also conducted structured Google searches and added outlets as they were discovered through interviews and consumption of other local Charlotte media. This process occurred over the course of six months. See the “Census of Local News Providers” section for the parameters and definitions we used regarding which providers to include.
After identifying local news providers and producing what is now most commonly referred to as a “news outlet census” (not to be confused with the US census, whose data we also use here), we collected as many articles as possible that were published between July 1, 2024, and June 30, 2025, from organizations that made online data collection possible. We were able to conduct scrapes of thirty-three of the sixty-six identified local news providers, as well as the website news for twenty civil society organizations, for a total of fifty-three organizations.
For each organization, we identified URLs that pointed to homepages or subpages that were dedicated to local news coverage. Our scraping protocol required all articles to be accessible in a single feed and/or page, and to have a dateline. We were not able to scrape articles from several organizations due to the way their data were structured or because they blocked scraping entirely. To find articles across each site, we used LLMs (a combination of ChatGPT and ScrapeGraph) to generate a separate scraper for each organization. For each article, the scrapers collected the article title, the publication date, the author (if available), and the URL. Each scraper was reviewed and tested by a human before running. Once we compiled the article links for the specified time period, we used the Newspaper3K Python package to extract the article text from the site.
To ensure adherence to organizations’ directives regarding content use for AI training, we collected each website’s robots.txt file, which often documents which AI bots from companies like Google or OpenAI are allowed to crawl a site. The primary model used in our AI pipeline is Anthropic Claude 3.5 Haiku, which we used when organizations did not prohibit Anthropic from AI ingestion. At the time of analysis, Haiku offered cheap, fast, and reliable performance in identifying complex location references, colloquial place-names, and implicit geographic context. For organizations that exclude Anthropic but permit OpenAI, we used GPT-5 Nano, which provides cheap and consistent performance. When organizations excluded all commercial providers, we deployed a hosted instance of the open-source GPT-OSS-120B model developed by OpenAI.
Content Analysis
We coupled a local news provider census with a content analysis that allows for mapping of both coverage areas and topics covered. Using LLMs, we have applied newly developed tools for understanding Charlotte’s local news and information landscape.
The geographic identification of places from unstructured text data, called toponym extraction and toponym resolution, has been significantly improved with the advent of easily accessible LLMs. Until recently, the field relied primarily on rule-based, gazetteer matching-based, or statistical learning-based approaches46[46] X. Hu, Z. Zhou, H. Li, Y. Hu, F. Gu, J. Kersten, and F. Klan, “Location reference recognition from texts: A survey and comparison,” ACM Computing Surveys, 56/5, 2023, pp. 1–37., and toponym extraction and resolution relied on highly formal and structured datasets. Prior efforts to automatically label local news article locations found that these texts prove particularly challenging to accurately label, since local news articles are often highly contextual, the formatting is inconsistent, and the text often includes references that are obscure to outsiders.47[47] “Mapping local news,” Brown Institute, Columbia University, 2021. brown.columbia.edu/mapping-local-news/ These constraints are uniquely positioned to be well-handled by LLMs, which by nature incorporate location-based and contextual information, and early results show that such models outperform traditional location identification methods.48[48] X. Hu, J. Kersten, F. Klan, and S.M. Farzana, “Toponym resolution leveraging lightweight and open-source large language models and geo-knowledge,” International Journal of Geographical Information Science, 2024, 1–28.
To extract locations mentioned in the articles, we developed a multi-stage AI processing pipeline that transforms raw article text into structured geographic data while respecting each news organization’s stated preferences regarding AI processing. The pipeline consists of four sequential stages: topic categorization, location extraction, location relevance filtering, and location disambiguation.
Assigning Topics and Extracting Locations from Article Text
Topic Categorization
Extracting locations from articles is aided by first determining what the article is about; knowing the topic an article covers allows the LLM to decide if a mentioned location is relevant. In the topic categorization stage, articles are classified into exactly one of many content categories using a hierarchical taxonomy with three tiers of specificity. The model analyzes article headlines and content text to assign categories such as crime, elections, housing, or transit. The system prioritizes the most specific category it can confidently assign, using built-in tiebreaker rules for common edge cases. Each classification includes a confidence score (0.0–1.0) and a rationale explaining the decision.
Location Extraction
The location extraction stage identifies all geographic references within the full article text, including headlines, bylines, datelines, and body content. The model extracts administrative units (cities, counties, states, countries), sub-city regions (neighborhoods, directional areas), transportation infrastructure (streets, highways, intersections), addresses, and named venues or landmarks. The extraction follows a strict literal-only principle: locations must be explicitly mentioned in the text and not inferred from context. Each location is categorized into one of fifteen specific types and classified as either “primary” (where the central news event occurred, capped at three) or “secondary” (providing background or context). The model outputs each extracted location and associated properties.
Location Relevance
The location relevance stage filters extracted locations to distinguish between geographic references central to the story and those that are tangential, figurative, or redundant. The model identifies and removes metonyms (e.g., “Washington” to mean the federal government), idiomatic expressions, symbolic uses, and generic unnamed places. When multiple extractions refer to the same place at different levels of specificity, only the most detailed version is retained to avoid double-counting in spatial analysis. Each location receives a boolean relevance indicator and an explanation of the relevance decision.
Location Disambiguation
The location disambiguation stage transforms location strings into precise, geocodable forms by adding contextual details derived from the article text. The model identifies geographic context clues—such as co-mentioned places in the same sentence or paragraph, dateline locations, quoted sources’ hometowns, and zip codes—to resolve ambiguous references.
For US locations, the model applies standardized formatting conventions (e.g., “City, ST” format using USPS state codes), expands road type abbreviations, and converts block numbers to full addresses. International locations follow regional conventions appropriate to their country.
Each disambiguation receives a confidence score (0.0–1.0) reflecting the strength of supporting evidence, with scores greater than 0.85 indicating strong anchor matches, 0.55–0.84 indicating plausible matches, and less than 0.40 indicating weak or ambiguous cases.
Geocoding and Spatial Enrichment
After AI processing extracted and disambiguated locations, we transformed these text references into geographic data through a multilayer spatial-enrichment pipeline using non-AI geospatial techniques. We geocoded location strings using the Google Geocoding API to obtain precise latitude and longitude coordinates. The geocoding process handles various location types, including street addresses, place-names, landmarks, and neighborhoods. Each geocoded location receives a confidence score and location type classification.
For US-based locations, we match geocoded points to their containing administrative and statistical boundaries using 2023 data, with exceptions for zip code tabulation areas (generated following the 2020 decennial census) and congressional districts (where we use 2024 boundaries for jurisdictions with recent redistricting, such as North Carolina). The matching process uses PostGIS spatial operations to determine point-in-polygon containment across multiple geographic levels: census tracts, counties, states, congressional districts, and zip code tabulation areas.
We enhanced each US geographic unit (in this case, census tracts) with demographic and economic indicators from the American Community Survey (ACS) five-year estimates (2019–2023). For updated congressional districts, we used resampled data provided by the Census Bureau. This included total population counts for per-capita calculations, race and ethnicity distributions to assess coverage equity, and median household income to understand economic context. The ACS integration enables normalization of raw coverage counts by population, revealing whether areas receive proportionate media attention relative to their demographic characteristics. Non-US locations were geocoded and displayed but do not receive census augmentation.
Location Validation
We validated the performance of our toponym extraction step through aggregated crowdworker ratings. To build the validation pipeline, we relied on past literature on crowdwork that advises gradual complexity increases and comparative approaches to optimize performance (Anderton et al., 2013). We sampled a hundred articles from our total dataset, using purposive sampling to ensure that no single organization was vastly more represented than others. We additionally ensured that these one hundred articles were distributed across the number of locations identified (one to five locations, twenty articles each), that the organizations primarily publish in English, and that no article was greater than two hundred and fifty words.
We then assigned fifty-one crowdworkers on Prolific to read and rate five articles each. The first article was always identified by our system as featuring one extracted location. The crowdworker was then asked to read the article and provided with a multi-choice question, each of which consisted of the real extracted location, a decoy location, or a third “Neither location is present in the article” option. The decoy locations were randomly sampled from all extracted locations in our dataset, as long as they were not also present in the rated article, so that they represented a plausible location. The crowdworker first rated an article with only one extracted location, then two, and so forth until the last article, which had five extracted locations. Each article was randomly selected from the set of twenty articles with the current number of locations. Additionally, crowdworkers were asked whether there were any missing locations from the article that had not been identified.
Our results demonstrate that we are able to identify locations with a high degree of accuracy. Across all articles and locations, crowdworkers provided 765 total location ratings (51 x (1+2+3+4+5)). Of these, 701 (91.6 percent) were correctly identified as the locations we had automatically extracted. These percentages remain stable regardless of how many locations have been extracted per article (48/51 correct ratings, or 94.1 percent, for articles with one location, compared with 234/255 correct ratings, or 91.8 percent, for articles with five locations), suggesting there is no decline in performance as the number of locations increases.
Data collection and analysis provided by Emma Goldhaber and C.J. Robinson; graphics produced by Tory Lysick; research assistance provided by Arielle Rosenthal and Allyssa King.
This research is generously funded by the North Carolina Local News Lab Fund, the John D. and Catherine T. MacArthur Foundation and the Patrick J. McGovern Foundation.
View interactive version here
Has America ever needed a media defender more than now? Help us by joining CJR today.