Sign up for the daily CJR newsletter.
Local journalism has become more important than ever. Even before the coronavirus pandemic, researchers were seeking new ways of seeing the local news landscape amid constant disruption. The Center for Cooperative Media’s News Ecosystem Mapping Project, which maps local news in New Jersey, is a response to this desire to better understand.
This study builds on the work of others in our field in two key ways: first, by identifying the complete range of journalistic news providers (print, digital, and broadcast) serving an entire US state, and second, by mapping those news providers according to the communities they cover, rather than where they are headquartered, as some have done.
Over the past two years, we have built a database of local news outlets for New Jersey. We compiled and eliminated any duplication from fourteen different lists of local news providers, including those produced by press associations, digital news networks, and trade organizations. Because of New Jersey’s somewhat unique position between two major media metropolises—New York City and Philadelphia—the list includes several outlets that are based across state lines.
Our research yielded a final tally of 779—a significant number, but one that is difficult to compare because, to our knowledge, no other state has a comparable list. Our hope is that this research can serve as a proof of concept that can be replicated elsewhere.
Those 779 outlets include news providers from all media—newspapers, digital-first or digital-native online outlets, radio stations, and television stations. Included within that number are university newspapers, outlets that primarily serve ethnic communities, and religious outlets that provide timely news and information about those important institutions. We also gathered information such as outlets’ websites (if any), ownership structures, and coverage area as reported by the outlet.
READ: There’s no wisdom in crowd photos
Using this self-reported coverage area, we built a map of local news outlets serving New Jersey. Because of this approach, a number of outlets—those with coverage areas that were not contiguous (e.g., “the Filipino community in the tri-state area”) or topic-based (e.g., state climate coverage)—are not represented on the map. In the content analysis we will conduct in the next phase of this research, we will assess which towns show up in the content produced by these outlets, as compared to the towns the outlets say they cover. For the reader’s reference, the list of outlets not represented on the map is included on the search-by-municipality page.
We are not the first to construct a map dedicated to local news providers, or to think holistically in terms of local news ecosystems. Early efforts out of the New America Foundation’s Media Policy Institute looked at the information environments of five cities and metropolitan areas, including Scranton, Pennsylvania, and the “research triangle” in North Carolina in 2010 and 2011; the Pew Research Institute conducted a study that looked at local news production and amplification in Baltimore in 2010. Meanwhile, new frameworks emerged from researchers such as Stephen Coleman and Michelle Ferrier, challenging the field to decenter traditional news publishers in the study of news ecosystems. More recently, Philip Napoli of Duke University and his colleagues have conducted several studies looking at the quantity and quality of local news production in different communities, while Penelope Muse Abernathy of the University of North Carolina at Chapel Hill and her colleagues have taken a thirty-thousand-foot approach to look at patterns in newspaper closures across the country.
While all these studies have similar goals—to holistically understand a city’s or community’s local news landscape, and to be able to make comparisons across communities—they take different approaches and therefore have different strengths and weaknesses. We look in detail at these different approaches in the paper written for the first phase of this project, written with Magda Konieczna, available here.
Structure of the map
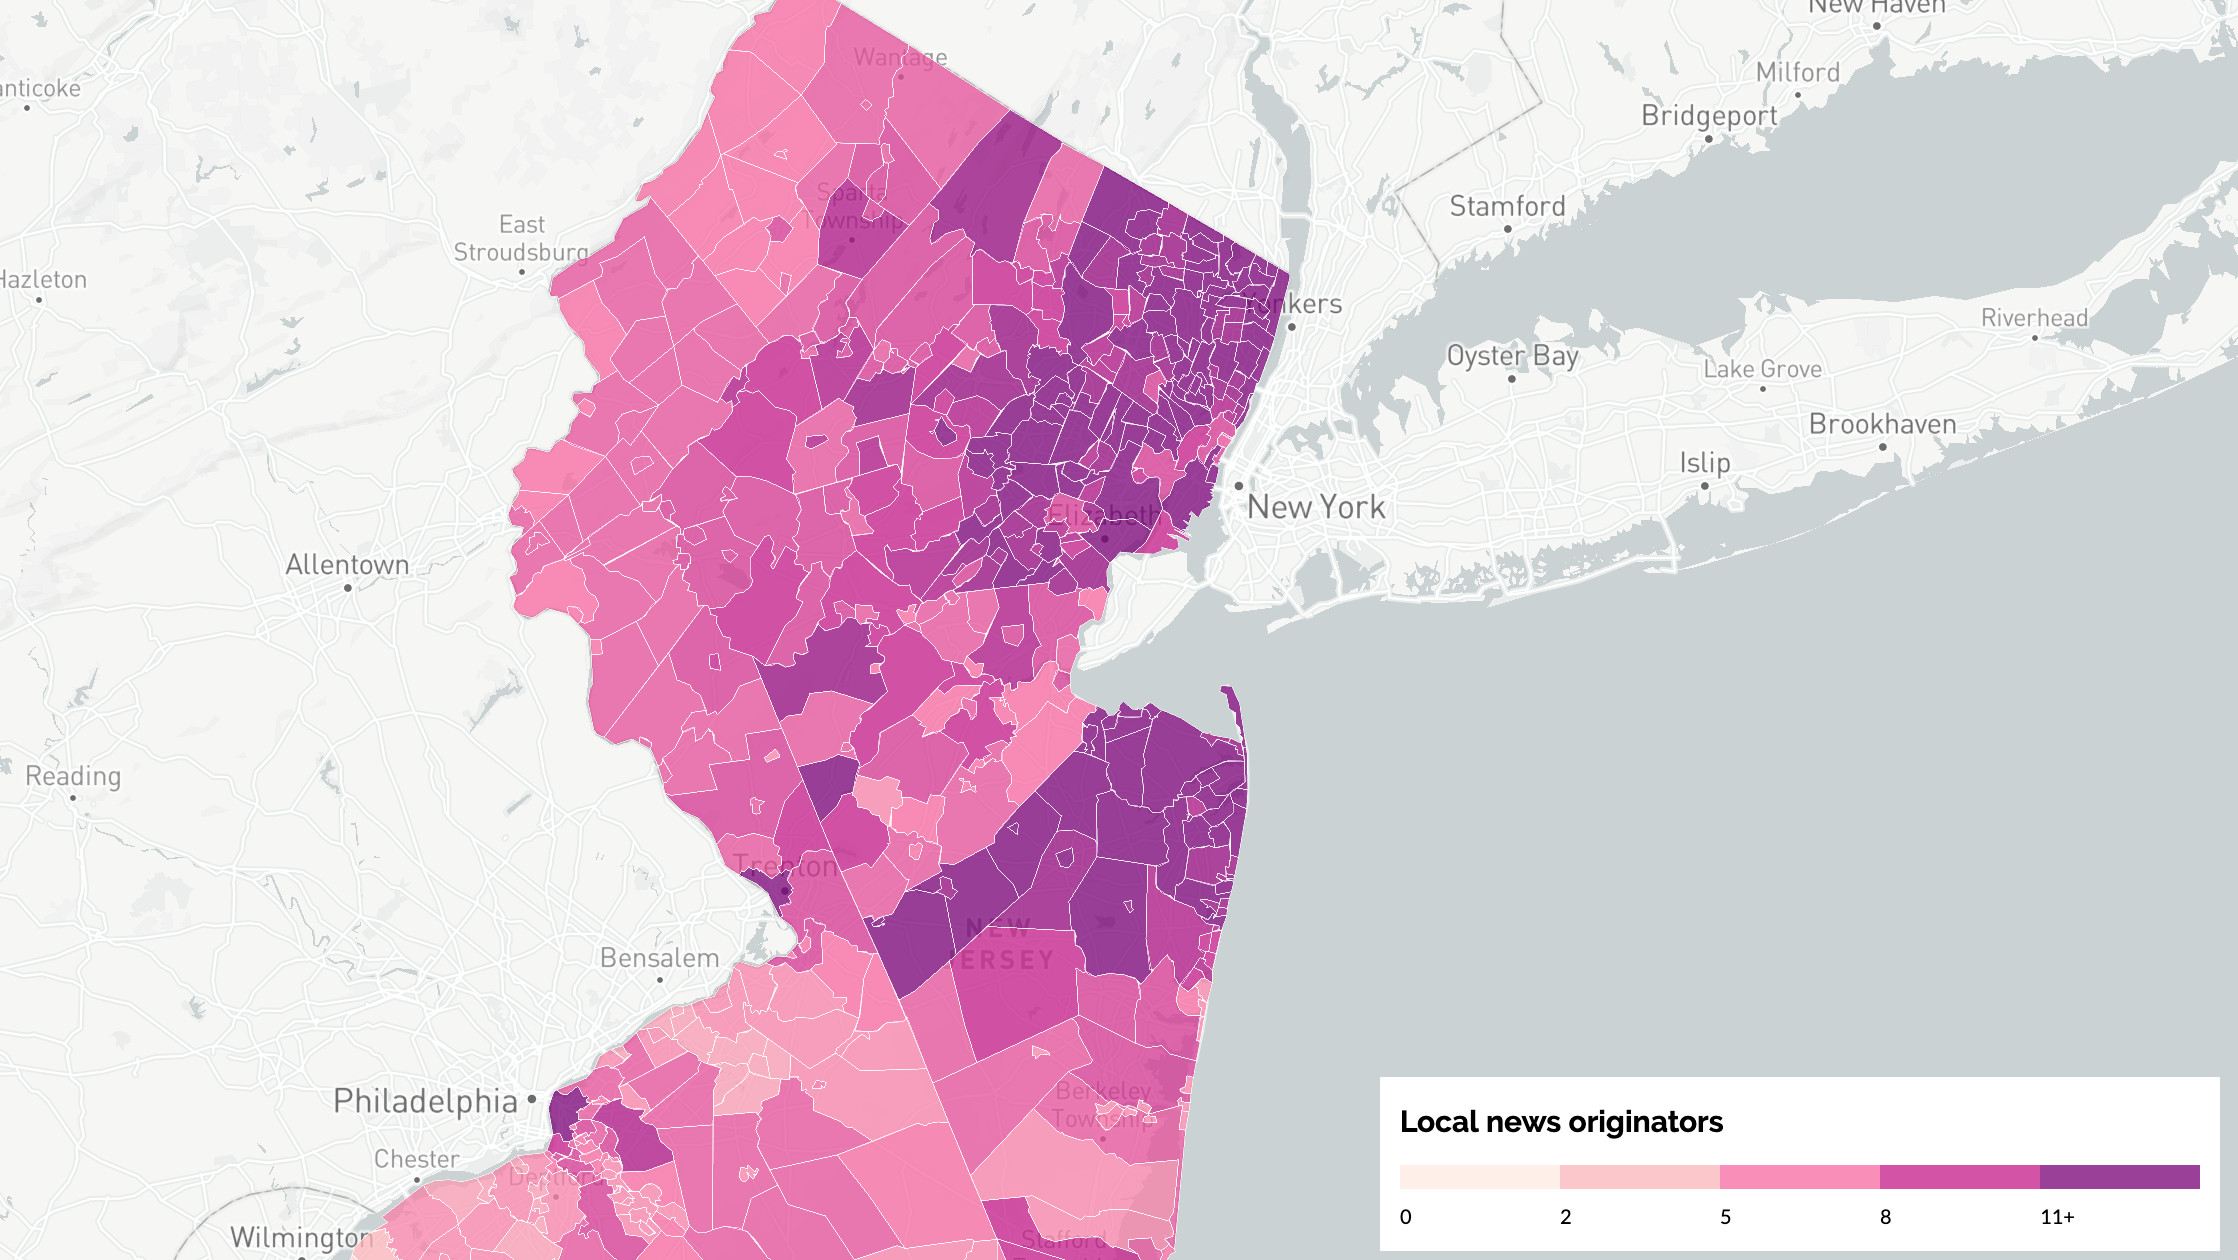
The top two layers of the map show the number of providers serving each municipality. “Total outlet count” includes the broadcast outlets that reach each municipality, while the next layer, “Local news originators,” shows only print outlets, digital outlets, and a handful of public broadcast stations. The pop-up box for each municipality lists the individual outlets that say they serve it, and shows the count of outlets by medium.
The purpose of the “Local news originators” layer is to highlight those outlets that are most likely to be producing original local news—the stories that then circulate through an ecosystem by means of radio, television, and social media. The patterns in this layer roughly mirror the “Median household income” layer and the “Population density” layer.
ICYMI: A battered FOIA collides with the $2 trillion bailout
The municipalities with the higher numbers, when the number of local news originators is weighted for population (layer “Local news originators per 10k population”) and income (layer “Local news originators per 10k income”), are those that have a density of outlets relative to those two measures.
The other layers—showing the percentage of the municipal population with a college degree or higher, municipal spending per capita, voter turnout, and which direction (Republican or Democrat) the municipality voted in the 2016 presidential election—will be useful in identifying the structural features of a community that either supports a robust local news ecosystem or does not.
New Jersey by the numbers:
- 565 municipalities, 21 counties
- 779 local news providers
- 308 newspapers (39.5% of total), 276 digital-first or online outlets (35.4% of total), 100 television stations (12.8% of total), 66 radio stations (8.5% of total), 29 magazines (3.7% of total)
- 113 ethnic news providers
- 83 public media outlets (including municipal-owned public access TV outlets)
- 320 conglomerate-owned (41.1%), 237 independently owned (30.4%), 72 municipal-owned (9.2%), 41 university-owned (5.3%), 8 owned by a religious institution (1%)
The highest total number of outlets serving a municipality is fifty-two, for Newark; the lowest is fourteen—a tie for Cape May Point, Wildwood City, and Wildwood Crest Borough.
In terms of local news originators, the highest number is twenty-four, again for Newark, followed by nineteen serving Montclair—an affluent and diverse suburb just outside of NYC. There are four municipalities—Elsinboro, Lower Alloways Creek, Quinton, and Alloway—with zero local news providers, and ten (including those four) that are not served by any local news originators. The most common number of local news originators (i.e., mode) per municipality is six.
More broadly, this project shows that, even at a moment of deep crisis for the business model that sustained journalism for many decades, there is a wide breadth and depth to local journalism that is often overlooked. It is crucial that the diversity and dynamism of local journalism be acknowledged in addition to the crisis. By looking at the local news landscape of an entire state at this level of granularity, we are able to see the complex microecology that exists. Much more work on the content and audience sides needs to be done, but by comprehensively mapping the local news landscape of an entire state, we can observe this crucial subsector in a way not seen before.
To house the map, we have built a website, newsecosystems.org, which also includes other resources such as links to colleagues’ work on local news ecosystems and a search function for finding local news providers by municipality. We hope it will be useful to many audiences, including funders, academics, and the general population, who want to discover local news providers near them.
The immediate next step will be to identify, using the data mapped here, the local news ecosystems within New Jersey. We are doing this by performing cluster analyses to discover the municipalities that are most often covered together (or not covered together, as the case may be). Once we have the outlines of the local news ecosystems that make up New Jersey, we will be able to perform analyses at both the ecosystem and the municipality level.
Note: 101 outlets (13%) fell into the “other” category, which comprises unidentifiable owners, including several ethnic-media owners, as well as small owners who have 2–3 entities in New Jersey.
Our sincere thanks to the Tow Center for Digital Journalism at Columbia University, and the funders of the Center for Cooperative Media, for supporting this research.
Has America ever needed a media defender more than now? Help us by joining CJR today.